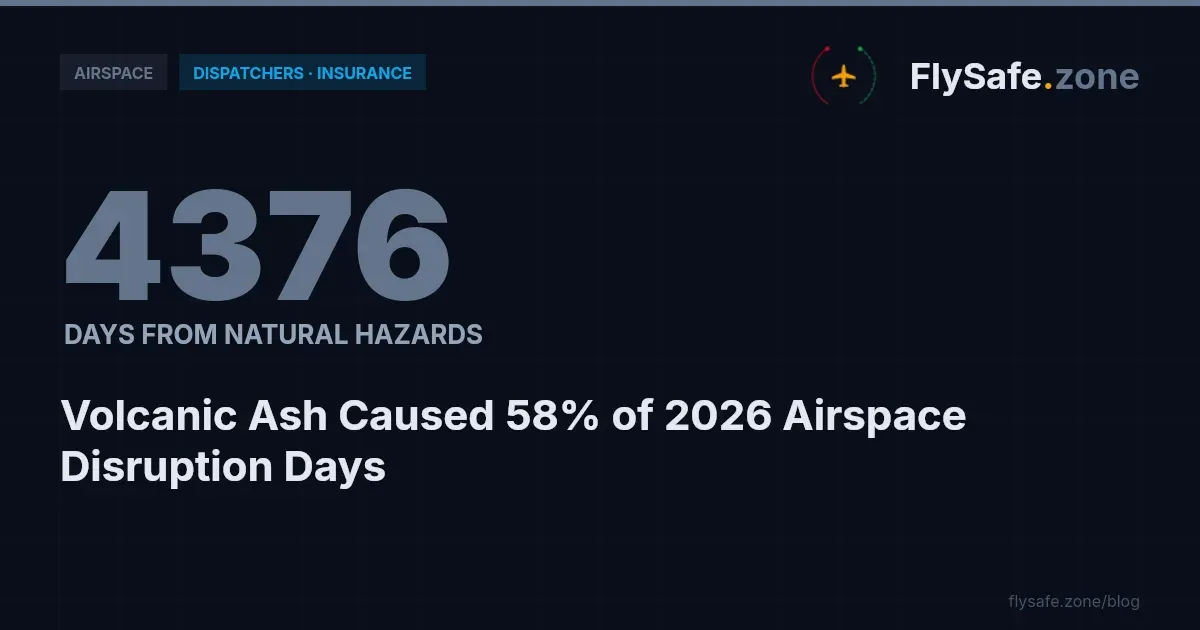
Search interest in regional airspace status — is Israel airspace open, is Qatar airspace closed, what is restricted this week — tends to concentrate on a handful of high-profile regions. The confirmed 2026 data tells a broader and less intuitive story. FlySafe airspace-risk collectors recorded 686 confirmed airspace-disruption events across 73 flight information regions (FIRs) between 1 January and 19 August 2026, totalling 5,769 airspace-days of disruption. The single largest driver was not conflict-zone activity but volcanic ash, which accounted for 57% of all disrupted airspace-days. This bulletin breaks the year down by disruption category, ranks the most-affected FIRs in each, and explains why NOTAM-only monitoring captures less than half of the confirmed picture. All figures are from the FlySafe confirmed-event dataset as of 2026-08-19.
The 2026 Cause-Category Mix: Volcanic Ash Leads
Every event in the dataset carries an attributed cause confirmed by at least two independent signals. Broken down by airspace-days (one FIR disrupted for one day = one airspace-day), the 2026 mix is:
| Category | Airspace-days | Share | Events |
|---|---|---|---|
| Volcanic ash | 3,300 | 57% | 316 |
| Conflict-zone restrictions | 1,907 | 33% | 244 |
| Seismic activity | 312 | 5% | 48 |
| Tropical cyclones | 153 | 3% | 32 |
| Other regulatory restrictions | 97 | 2% | 46 |
Two observations follow directly from the data. First, natural hazards — volcanic ash, seismic activity, and tropical cyclones combined — account for roughly 65% of all disrupted airspace-days in 2026, substantially more than conflict-zone restrictions. Second, the categories behave differently: volcanic ash produces many events of significant cumulative duration (316 events, 3,300 days), while "other regulatory restrictions" produce numerous but short-lived events (46 events, only 97 days).
Most-Affected FIRs in Each Category
FlySafe analysis shows a clear geographic concentration within each category, cited here by ICAO FIR designator.
Volcanic ash: SEFG (510.0 airspace-days), RPHI (502.0), and SKED (495.0) lead the category. Notably, these three FIRs alone account for over 1,500 of the category's 3,300 airspace-days.
Conflict-zone restrictions: Damascus FIR (OSTT) recorded 795.0 airspace-days across 70 events — the highest figure for any single FIR in the entire dataset. UUWV followed with 445.0 airspace-days (37 events), and Tehran FIR (OIIX) with 321.0.
Seismic activity: MMFR dominated the category with 223.0 airspace-days of the 312 total, followed at a distance by MMID (25.0) and RJDG (21.0).
Tropical cyclones: ZSHA absorbed 94.0 of the category's 153 airspace-days, with KZAK (21.0) and MMID (13.0) behind it.
Other regulatory restrictions: short, distributed events — KZLC, KZMP, and KZJX each logged 10.0 airspace-days.
A fuller ranking across all categories is available in 2026's most-disrupted FIRs ranked by NOTAM and traffic data.
Is Qatar Airspace Closed? Is Canada Airspace Closed? What Common Queries Miss
Frequent search queries — israel airspace status, is Qatar airspace closed, canada airspace closed — do not align with where 2026's confirmed disruption actually concentrated. None of the FIRs associated with those queries appears among the most-disrupted FIRs in the confirmed-event ranking for the January–August 2026 window. The dataset does not include a dedicated breakdown for those regions, so no figure is stated here; what can be stated is that the top of the ranking is occupied by Damascus FIR (OSTT), SEFG, RPHI, SKED, SPIM, and UUWV.
This gap between public attention and measured disruption is a recurring pattern. Regions covered heavily in general media are not necessarily the regions where airlines lose the most usable airspace — as the per-FIR figures above show, several of the largest 2026 losses were driven by volcanic ash rather than any security situation. A comparable region-level analysis is available for UAE airspace and the FIRs that lost the most days in 2026 and for Caribbean airspace in the 2026 data.
Terminology matters when interpreting such queries: an airspace volume is "closed" only when the responsible civil aviation authority has issued a NOTAM or AIP entry prohibiting all civil operations. Many 2026 events involved restricted operations (conditional access) or carrier-specific limitations rather than full closure, and the confirmed-event dataset counts all such disruption categories.
Why NOTAM-Only Monitoring Misses the Majority
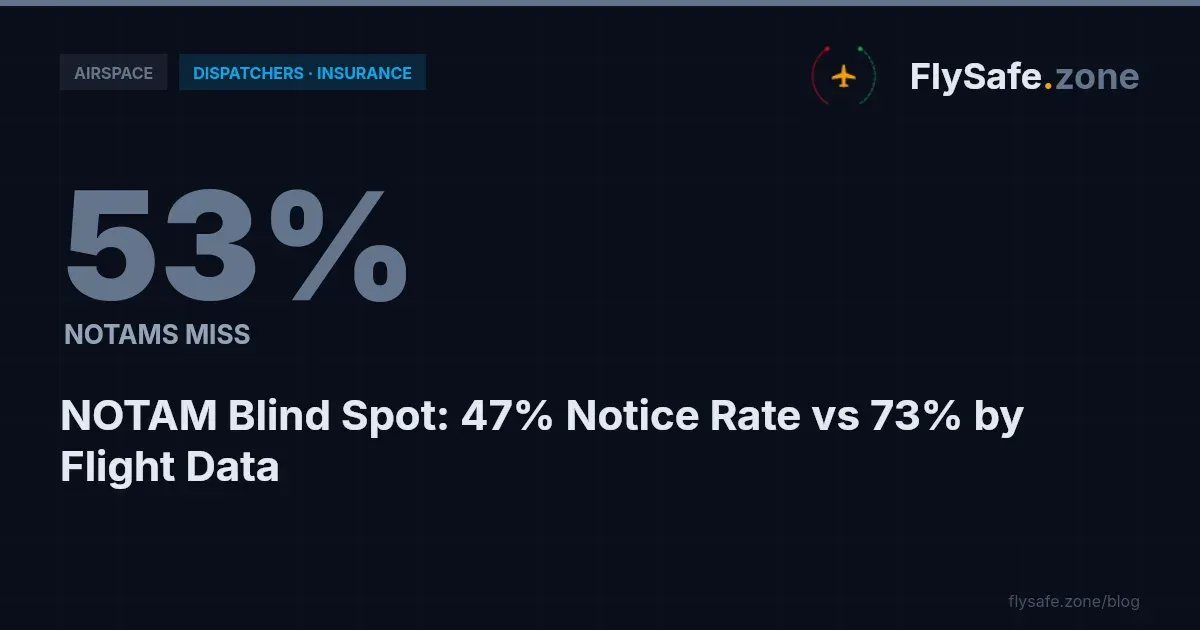
Across FIRs with at least three confirmed events, FlySafe's own ADS-B flight-traffic collection corroborated approximately 73% of events, while NOTAMs corroborated approximately 46%. A review process relying on NOTAMs alone would therefore miss the majority of confirmed disruptions.
The per-FIR corroboration figures illustrate why both signals are needed:
- UUWV: flight-traffic corroborated 97% of events; NOTAM only 81%.
- Damascus FIR (OSTT): flight-traffic 27%; NOTAM 71%.
- SEFG and RPHI (volcanic ash): flight-traffic 0%; NOTAM 96–100%.
- SKED and SPIM: both signals at 100%.
Ash-driven events tend to be formally documented through the NOTAM and advisory system but may not register in traffic patterns, while other disruptions appear clearly in traffic behaviour before or without formal notices. Routine planning products such as the TAF (aerodrome forecast) address expected weather at aerodromes, not airspace status, and are no substitute for disruption monitoring. The corroboration gap is examined in detail in why NOTAMs miss most airspace disruptions in 2026.
Monthly Trend and Recovery
Confirmed events by month in 2026: January 5, February 16, March 1, April 21, May 72, June 143, July 350, August 78 (partial month, through 19 August). July alone accounted for just over half of all confirmed events year-to-date.
Recovery data offers useful context for operators: all 686 confirmed disruptions in the window have ended, 339 of them within the last 30 days. The average confirmed disruption ran approximately 8.4 airspace-days. Airspace disruption in 2026 has been persistent in aggregate but individually temporary — no confirmed event in the dataset remains open as of 2026-08-19.
Data on financial impact, specific NOTAM references per event, or individual carrier routing decisions is not currently available in this dataset and is not estimated here.
Regulatory Context
The disruption categories above map onto established regulatory frameworks:
- ICAO Annex 11 (Air Traffic Services) governs how states organize and delegate FIRs — the unit of measurement used throughout this bulletin. ICAO standards also define the terminology of prohibited, restricted, and danger areas.
- ICAO Annex 15 (Aeronautical Information Services) establishes the NOTAM and AIP system through which closures and restrictions are formally promulgated — the same public system whose 46% corroboration rate is measured above.
- EASA Conflict Zone Information Bulletins (CZIBs) provide advisory-only risk information for conflict-zone airspace; where a state CAA has not adopted a restriction via NOTAM, a CZIB remains advisory.
- EU Regulation 965/2012 (Air Operations) requires operators under EASA oversight to assess route risks as part of their operational decision-making, which is where category-level disruption data becomes directly actionable.
- 14 CFR Part 91 (FAA) imposes general operating rules on US operators, including compliance with airspace restrictions published via the FAA NOTAM system.
Methodology & Provenance
- Source: FlySafe airspace-risk collectors; window 2026-01-01 to 2026-08-19; data as of 2026-08-19.
- Confirmation standard: the FlySafe consensus engine requires at least two independent signals per event plus an attributed cause. Detections with undetermined cause are excluded from all figures in this bulletin.
- Inputs: public NOTAM data, EASA advisories, FAA TFRs, volcanic-ash and seismic advisories, and FlySafe's own ADS-B flight-traffic collection, which serves as the primary corroborating signal.
- Unit: one airspace-day equals one FIR disrupted for one day.
Analysis is based on publicly available data only. FlySafe is not an operational authority; nothing in this bulletin constitutes operational guidance, and operators must rely on official NOTAMs, AIPs, and their state CAA for flight-planning decisions.
Key Takeaway
Volcanic ash — not conflict-zone activity — was the largest single cause of lost airspace in 2026, at 57% of 5,769 confirmed airspace-days across 73 FIRs. The most-disrupted individual FIR, Damascus FIR (OSTT) at 795 airspace-days, sits in the conflict-zone category, but the category totals show natural hazards driving roughly two-thirds of the year's disruption. Because NOTAMs corroborate under half of confirmed events, operators and analysts monitoring airspace status benefit from multi-signal coverage. FlySafe maintains this confirmed-event dataset continuously across all monitored FIRs; the full rankings and category breakdowns are available on the FlySafe platform.
- Volcanic ash was the dominant airspace disruption cause in 2026, accounting for 57% of all disrupted airspace-days — and natural hazards combined (ash, seismic, cyclones) reached ~65%, substantially more than conflict-zone restrictions, which is the inverse of where public search attention concentrates.
- Disruption categories differ structurally in how they accumulate impact: volcanic ash averages ~10 days per event (316 events, 3,300 days), while regulatory restrictions average ~2 days per event (46 events, 97 days) — a meaningful distinction when estimating duration risk versus frequency risk.
- Damascus FIR (OSTT) recorded 795 airspace-days across 70 events — the highest figure for any single region in the entire 2026 dataset, exceeding even the top volcanic-ash FIRs; within the volcanic-ash category, three FIRs alone (SEFG, RPHI, SKED) account for nearly half the category total.
Powered by B1KEY
Live tools behind the analysis.
The signals FlySafe writes about are also published live — continuously verified by the Sentinel pipeline.
Information is accurate as of the publication date. FlySafe uses exclusively publicly available data.