Nairobi (NBO) Traffic Drop — Observed Movements Down 47–61% on Saturday 17 October 2026 on Two Independent ADS-B Feeds
- Observed traffic at NBO fell 47–61% on Saturday 17 October depending on the feed, confirmed on two independent ADS-B networks — the cause is not attributed.
- From 17 to 19 October our primary feed lost most of its arrival-side coverage at NBO and recorded no departure for 24 hours from 18 October 13:00 UTC, so its lowest readings (69, 34) are a coverage floor; on Tuesday 20 October both feeds read a third to 40% below baseline; from Wednesday 21 October the independent feed is back at baseline and the primary feed reads within its normal range (21–24 October settled at 231–266); on Sunday 25 October both feeds read 26–32% low (171, and a settled 186), on Monday 26 October both were back above baseline (290, and a settled 280), on 27–28 October both read inside the normal range (primary feed a settled 241 and 228; independent feed 255 and 222), on Thursday 29 October both read below it (independent feed 139, −45%; primary feed a settled 166, −34%), and on Friday 30 October both were back inside it (247, and a settled 245).
- A third episode on 7–11 November took the primary feed to a settled 150 on 9 November and the independent feed to 149, 10 and 86 on 9–11 November; the primary feed is unreadable from 10 November (a network-wide collection failure), the independent feed read 266 on 15 November (+6%), and tracking closed on 16 November.
- No confirmed airspace closure, volcanic ash or GNSS interference was detected in the Kenya FIR (HKNA) — the signal is a traffic anomaly without a matched operational trigger.
- Check your airline's status: our data shows the measured picture, not the cause — disruption decisions belong to operators and authorities.
Advisory timeline — how active is this episode
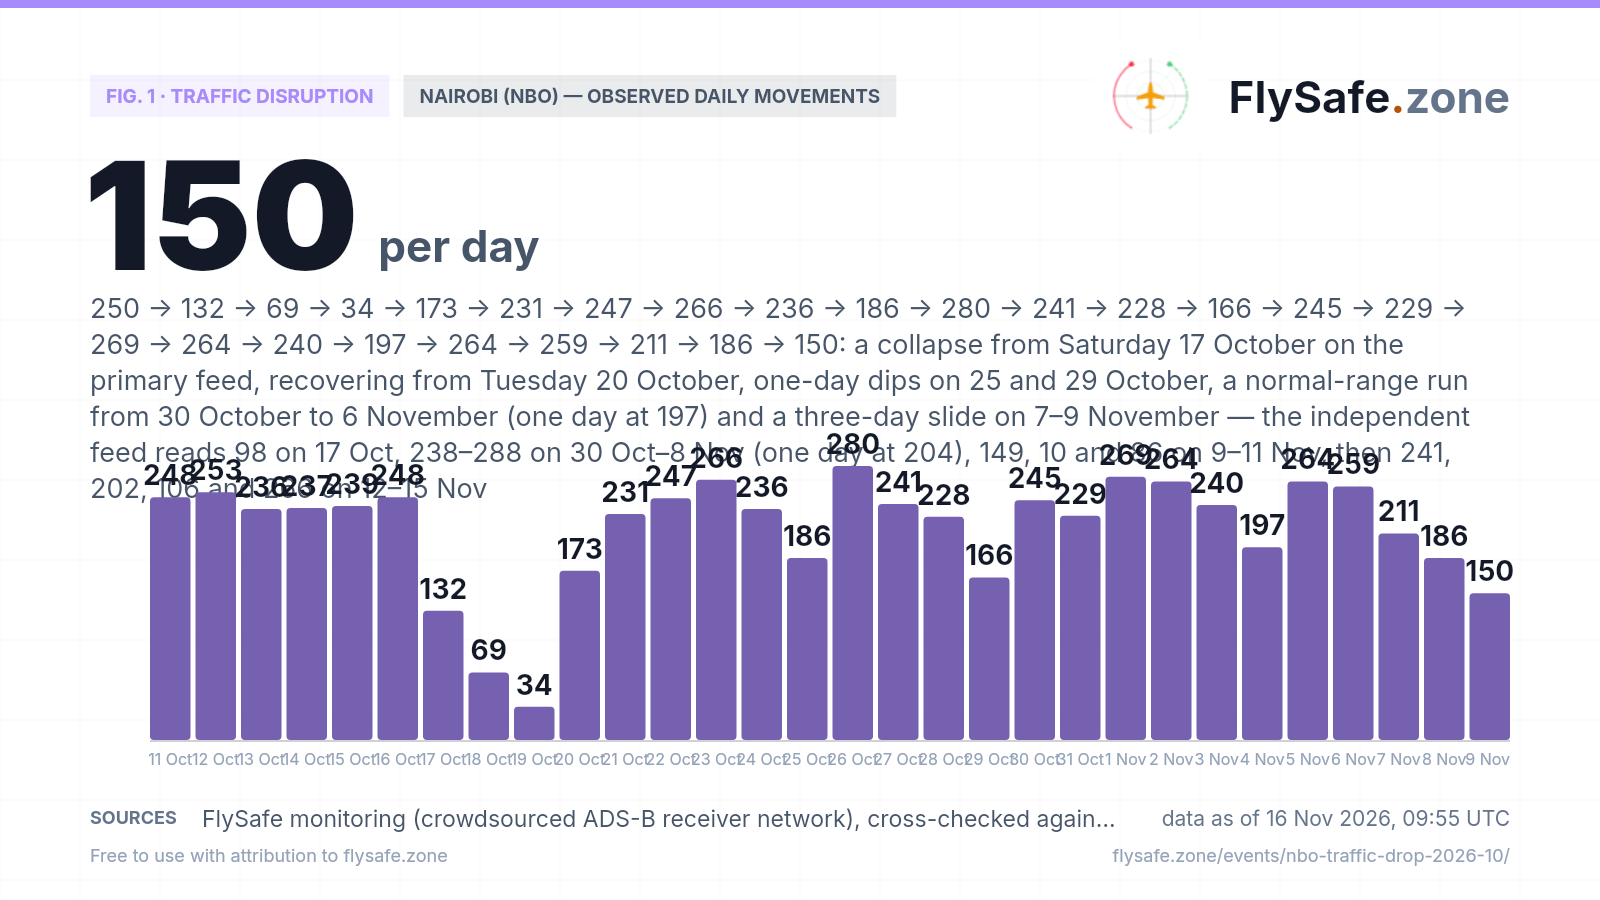
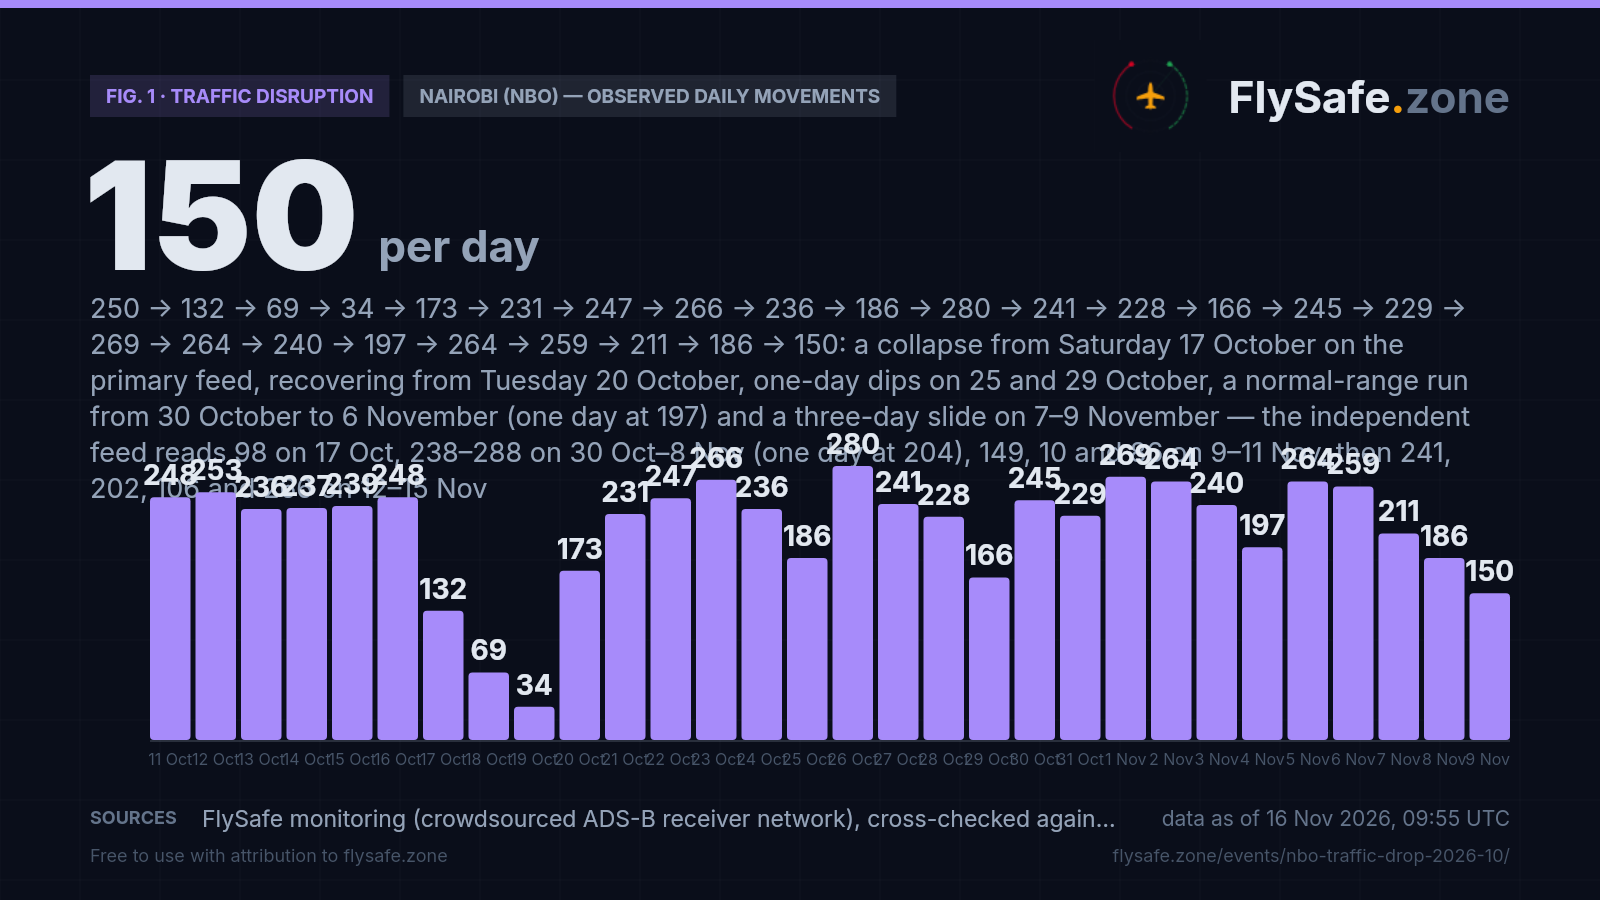
Nairobi's Jomo Kenyatta International (NBO) ran at a stable ~250 observed movements per day through the 30-day window ending 16 October. On Saturday 17 October the primary ADS-B feed settled at 132 movements (107 departures, 25 arrivals) — −47% against that baseline; the first-pass reading published here on 20 October was 68, and the final refresh roughly doubled it. The independent ADS-B aggregate read 98 movements (56 departures, 42 arrivals) for the same day — −61%. Both feeds agree on a sharp reduction; they disagree on its depth. The primary feed's arrival side is the problem: 25 arrivals against roughly 100 on a normal day, then 3–4 a day on 18–19 October, while departures were still recorded (66 on 18 October, 30 on 19 October). Every aircraft that lands must depart again, so a departures-only picture is a receiver-coverage signature, not a traffic signature — and between 13:00 UTC on 18 October and 13:00 UTC on 19 October the primary feed holds no NBO departure and six arrivals in total. The 69 and 34 plotted for 18–19 October are therefore a coverage floor, not a traffic level. On Tuesday 20 October the primary feed's arrivals came back — 173 movements (95 departures, 78 arrivals), −31% (the late-ingest pass added six departures to the 167 published on 22 October). On Wednesday 21 October it settled at 231 (126 departures, 105 arrivals), −8%, on the final refresh of 25 October; Thursday 22 October settled at 247 (141 / 106), −1%, Friday 23 October at 266 (147 / 119), +6%, and Saturday 24 October at 236 (129 / 107), −6%, on the final refresh of 28 October — all four days inside the 196–284 range of the 29 pre-event days. Sunday 25 October reads lower: 186 (114 / 72), −26%, settled on the final refresh of 29 October, which added nothing to the 186 published on 28 October — and the shortfall sits before 12:00 UTC, when the feed records 59 departures and six arrivals against 91 and 40 on Sunday 11 October; from 12:00 UTC its counts (55 / 66) are at that Sunday's level (48 / 69). Monday 26 October reads 280 (162 / 118), +12%, settled on the final refresh of 30 October, which added nothing to the 280 published on 29 October (the late-ingest pass had added eleven departures to the 269 published on 28 October), with 54 arrivals before 12:00 UTC — the morning gap did not repeat. Tuesday 27 October reads 241 (137 / 104), −4%, settled on the final refresh of 31 October, which added nothing to the 241 published on 30 October (the late-ingest pass had added ten departures to the 231 published on 29 October), with 90 departures and 46 arrivals before 12:00 UTC. Wednesday 28 October reads 228 (135 / 93), −9%, settled on the final refresh of 1 November (the late-ingest pass added eight departures to the 220 published on 30 October) — inside the 196–284 range, but the lowest Wednesday on this feed since 18 September — and from 20:00 UTC to midnight it holds a single NBO movement, a departure at 21:37 UTC added by that pass (the last arrival is at 19:44 UTC), a window that held 7–15 movements on each of the other days from 11 to 27 October outside 17–19 October. Thursday 29 October settled at 166 (96 / 70), −34%, on the final refresh of 2 November (the late-ingest pass added ten departures to the 156 published here on 31 October) — below the 196–284 range and the lowest reading on this feed since 19 October. The shortfall sits before 12:00 UTC, when the feed records 48 departures and eight arrivals against 90 and 40 on Thursday 15 October — the morning shape of 25 October; from 12:00 UTC its total (110) is at that Thursday's (109). The independent aggregate has no NBO row for 18–19 October, reads 151 on Tuesday 20 October (71 departures, 80 arrivals), 40% below its own 252-movement baseline, then 261 on Wednesday 21 October (130 departures, 131 arrivals), 259 on Thursday 22 October (125 / 134), 283 on Friday 23 October (142 / 141) and 247 on Saturday 24 October (120 / 127) — back at that baseline — then 171 on Sunday 25 October (83 / 88), 32% below it and 35% below its four pre-event Sundays (251–273), then 290 on Monday 26 October (138 / 152), 15% above it and its highest reading since 18 September, and 255 on Tuesday 27 October (127 / 128), 1% above it, then 222 on Wednesday 28 October (104 / 118), 12% below it and 14% below its four pre-event Wednesdays (237–266) — its lowest Wednesday since 18 September, though inside the 202–283 range of its 29 pre-event days — then 139 on Thursday 29 October (65 / 74), 45% below it and 40% below its four pre-event Thursdays (202–243): below that range, and its lowest reading since 17 October — then 247 on Friday 30 October (117 / 130), 2% below it and back inside the 202–283 range of its 29 pre-event days, though 10% below its four pre-event Fridays (268–283). From 30 October to 6 November the primary feed settled inside its normal range on seven of eight days (245, 229, 269, 264, 240, 264, 259; Wednesday 4 November at 197, −21%), and the independent aggregate read 204–288 (no row for 6 November). On 7–9 November the primary feed slid to 211, 186 and 150 (−16%, −26%, −40%, settled), its arrivals falling faster than its departures (72, 65 and 50 arrivals against 139, 121 and 100 departures) — the coverage-loss shape of 17–19 October; the independent aggregate read 242 and 259 on 7–8 November, then 149, 10 and 86 on 9–11 November (−41%, −96%, −66%) with its global collection at its usual level (462–474 airports). From 10 November the primary feed's collection failed network-wide (16–20 thousand departures a day worldwide, against 131–146 thousand on 1–9 November), so its NBO counts for 10–15 November are a gap, not a reading. The independent aggregate read 241 and 202 on 12–13 November, 106 on Saturday 14 November (−58%) and 266 on Sunday 15 November (+6%), inside its 202–283 normal range. Daily observed movements on the primary feed over the recent window:
Fig. 1 — Observed movements at Jomo Kenyatta International (NBO) per UTC day, 11 Oct–9 Nov 2026, primary feed; counts are a floor (crowdsourced ADS-B), not a total; the cross-check values are the independent ADS-B aggregate's (no row for 18–19 Oct or 6 Nov); every plotted day is settled; 10–15 Nov are not plotted because the primary feed's network-wide collection fell to 16–20 thousand departures a day (from 131–146 thousand on 1–9 Nov), so its NBO counts for those days are unreadable; 18–19 Oct were recorded while the primary feed held no NBO departure for 24 hours (18 Oct 13:00–19 Oct 13:00 UTC); 25 Oct on the primary feed has six arrivals before 12:00 UTC; 28 Oct on the primary feed has a single movement after 19:44 UTC; 29 Oct on the primary feed has eight arrivals before 12:00 UTC · Data as of 16 Nov 2026, 09:55 UTC · Source: FlySafe monitoring (crowdsourced ADS-B receiver network), cross-checked against an independent ADS-B aggregate.
Airports in the exposure zone
| Airport | Size | Observed signal | FIR |
|---|---|---|---|
| Jomo Kenyatta International (NBO) | large | — · traffic anomaly — no attributed cause | HKNA |
Distance alone does not determine impact — wind direction and the flight levels the ash reaches decide which airports and routes are affected on a given day. FIR = Flight Information Region.
What our monitoring showed: a confirmed drop on 17 October, a primary feed that went blind at Nairobi for two days, a recovery from 20 October, dips on 25 and 29 October, and a deeper episode on 7–11 November
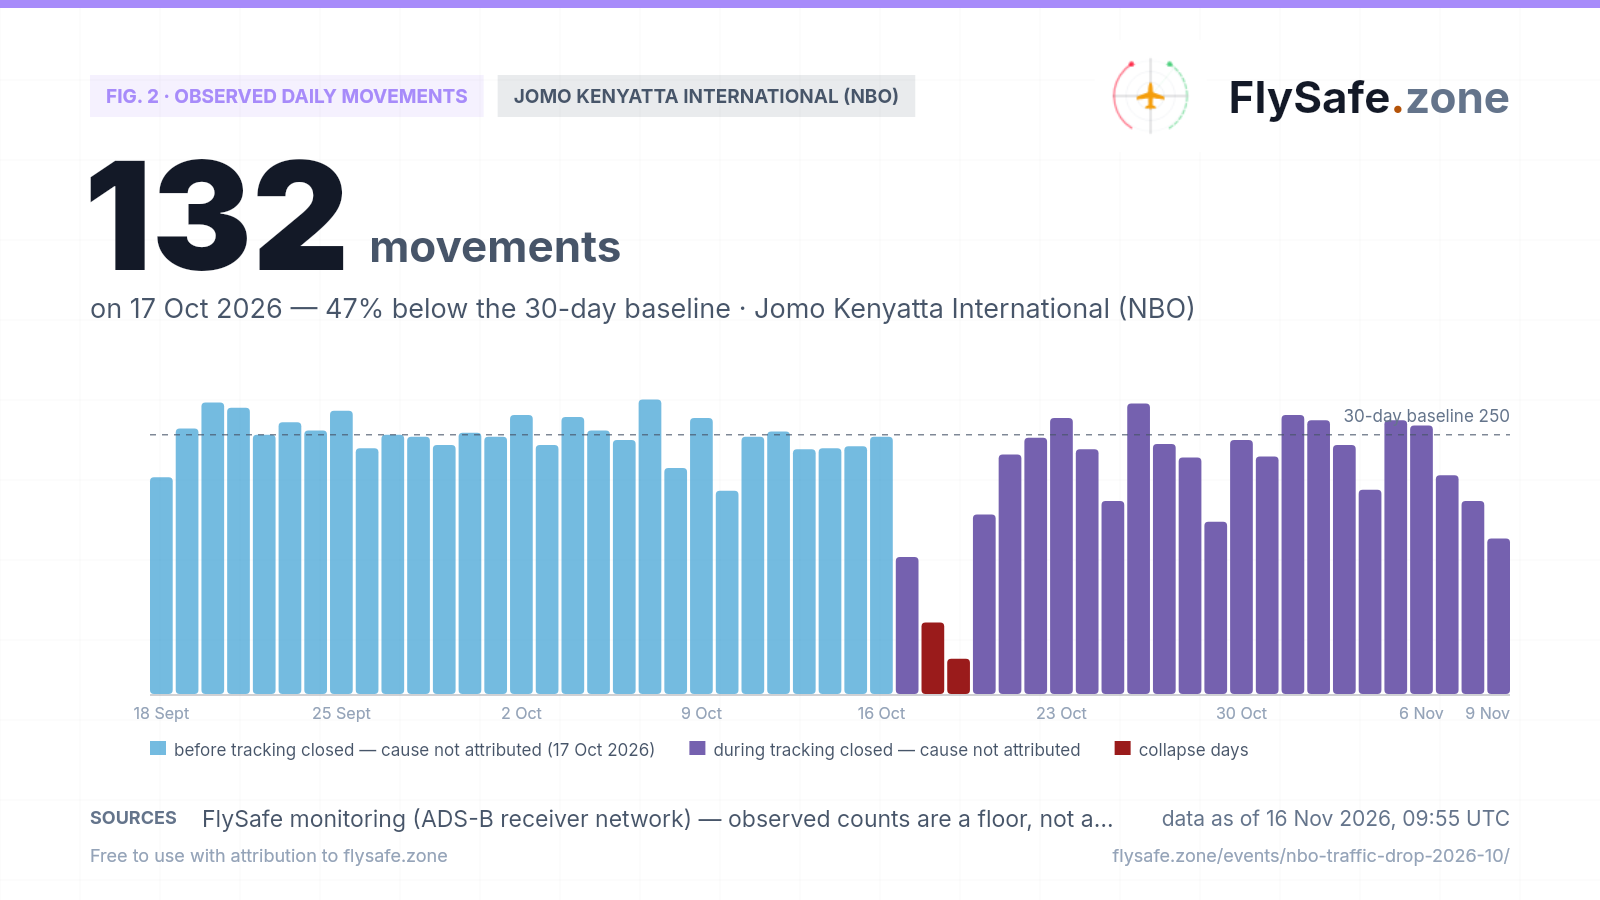
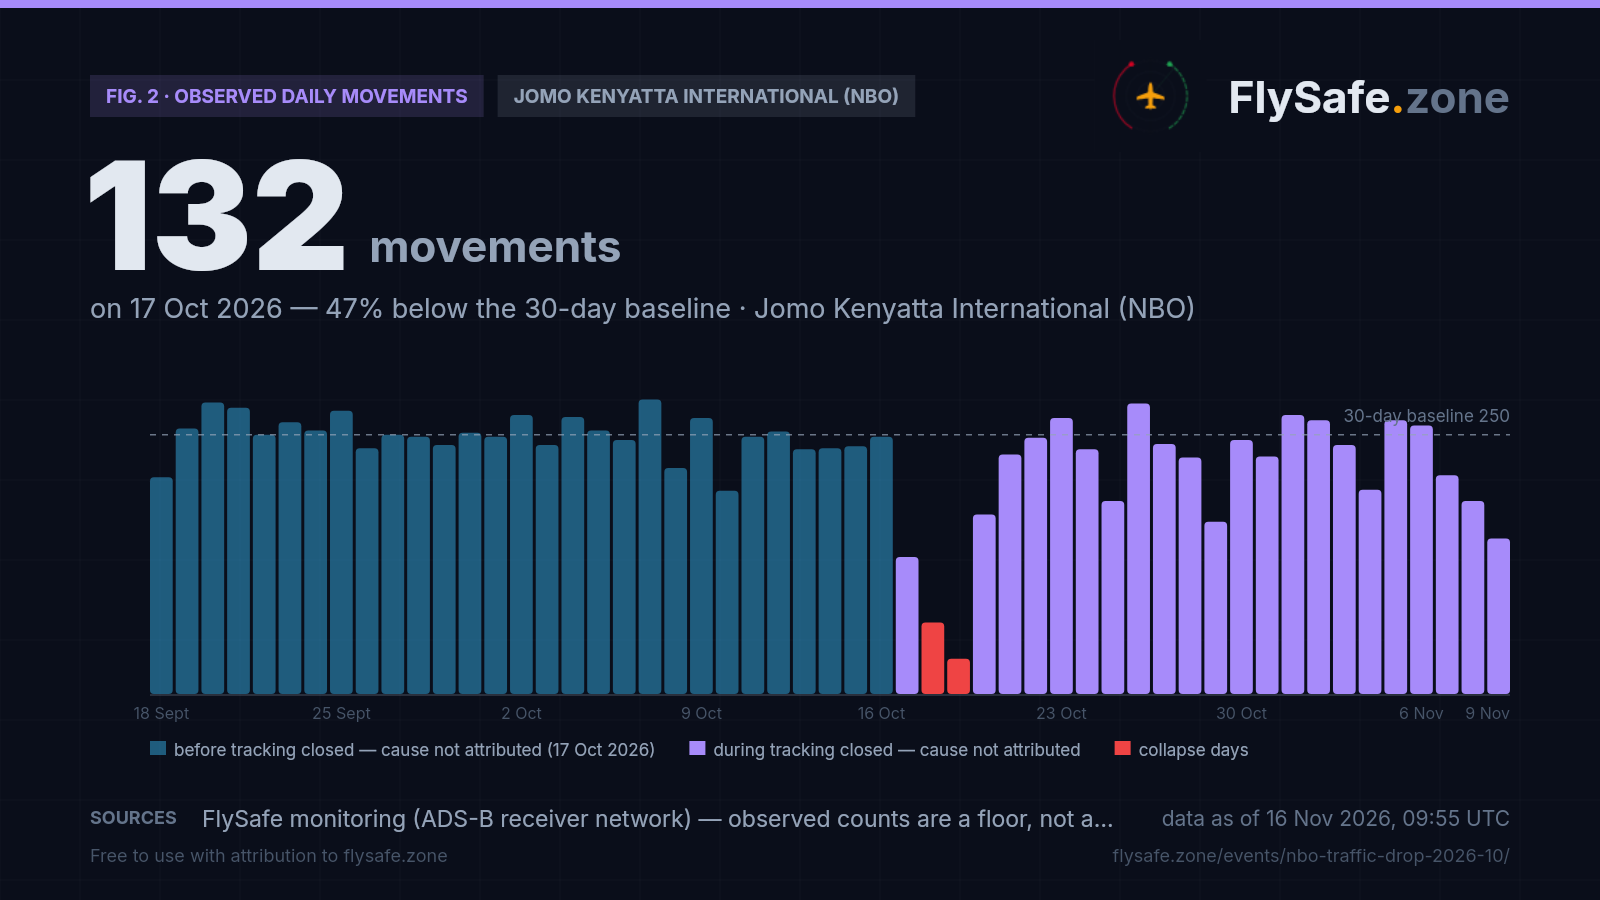
FlySafe tracks observed departures and arrivals at 493 airports from crowdsourced ADS-B receiver data. Observed counts are a floor, not a total — receiver coverage varies — but an airport measured against its own baseline is a reliable shape. Jomo Kenyatta International's last 30 days:
Fig. 2 — Observed daily movements at NBO, 18 Sept – 9 Nov (latest complete UTC day). Data as of 16 Nov 2026, 09:55 UTC · Source: FlySafe monitoring (ADS-B receiver network).
- 30-day pre-event baseline (18 Sep–16 Oct): ~250 observed movements/day on the primary feed (mean of 29 settled days); the independent aggregate averages 252 over the same days.
- Saturday 17 October, primary feed (settled on the final refresh): 132 (107 dep / 25 arr), −47%. Independent cross-check: 98 (56 dep / 42 arr), −61%. The drop is real on both feeds; its depth differs by feed. The first-pass primary reading published on 20 October was 68.
- Sunday 18 October, primary feed (settled on the final refresh of 22 October, which added nothing): 69 (66 dep / 3 arr) — every departure recorded before 13:00 UTC, none after. Independent aggregate: no row for this day.
- Monday 19 October, primary feed: 34 (30 dep / 4 arr), every departure after 13:00 UTC — settled on the final refresh of 23 October. Independent aggregate: no row.
- Tuesday 20 October, primary feed: 173 (95 dep / 78 arr), −31% against the 250 baseline and −29% against the four previous Tuesdays (236–250). The late-ingest pass added six departures to the 167 published on 22 October, and the final refresh of 24 October settled the day at 173. Independent aggregate: 151 (71 dep / 80 arr), −40% against its 252 baseline.
- Wednesday 21 October, primary feed: 231 (126 dep / 105 arr), −8% against the 250 baseline and −11% against the four previous Wednesdays (237–284), with arrivals at a normal level. The late-ingest pass added ten departures to the 221 published on 23 October, and the final refresh of 25 October settled the day at 231. The 29 pre-event days ranged from 196 to 284, so 231 sits inside normal day-to-day variation. Independent aggregate: 261 (130 dep / 131 arr), 4% above its 252 baseline — the first reading at normal level since 16 October.
- Thursday 22 October, primary feed: 247 (141 dep / 106 arr), −1% against the 250 baseline and +3% against the four previous Thursdays (218–254); the late-ingest pass added nine departures to the 238 published on 24 October, and the final refresh of 26 October settled the day at 247. Independent aggregate: 259 (125 dep / 134 arr), 3% above its baseline.
- Friday 23 October, primary feed: 266 (147 dep / 119 arr), +6% against the 250 baseline and +1% against the four previous Fridays (248–273); the late-ingest pass added eleven departures to the 255 published on 26 October, and the final refresh of 27 October settled the day at 266. Independent aggregate: 283 (142 dep / 141 arr), 12% above its baseline.
- Saturday 24 October, primary feed: 236 (129 dep / 107 arr), −6% against the 250 baseline and +2% against the four pre-event Saturdays (196–256) — settled on the final refresh of 28 October, which added nothing to the 236 published on 27 October. Independent aggregate: 247 (120 dep / 127 arr), 2% below its baseline.
- Sunday 25 October, primary feed: 186 (114 dep / 72 arr), −26% against the 250 baseline and −29% against the four pre-event Sundays (248–281) — settled on the final refresh of 29 October, which added nothing to the 186 published on 28 October (the late-ingest pass had added five departures to the 181 published on 27 October). Before 12:00 UTC it records 59 departures and six arrivals (Sunday 11 October: 91 and 40); from 12:00 UTC, 55 and 66 (11 October: 48 and 69). Independent aggregate: 171 (83 dep / 88 arr), −32% against its 252 baseline and −35% against its four pre-event Sundays (251–273); that feed's global collection was at its usual level that day (464 airports).
- Monday 26 October, primary feed: 280 (162 dep / 118 arr), +12% against the 250 baseline and +9% against the four pre-event Mondays (248–276) — settled on the final refresh of 30 October, which added nothing to the 280 published on 29 October; the late-ingest pass had added eleven departures to the 269 published on 28 October. Before 12:00 UTC it records 110 departures and 54 arrivals, so the morning arrival gap of 25 October did not repeat. Independent aggregate: 290 (138 dep / 152 arr), 15% above its 252 baseline and its highest reading since 18 September, with global collection at its usual level (469 airports).
- Tuesday 27 October, primary feed: 241 (137 dep / 104 arr), −4% against the 250 baseline and −1% against the four pre-event Tuesdays (236–250) — settled on the final refresh of 31 October, which added nothing to the 241 published on 30 October; the late-ingest pass had added ten departures to the 231 published on 29 October; before 12:00 UTC it records 90 departures and 46 arrivals. Independent aggregate: 255 (127 dep / 128 arr), 1% above its baseline (global collection 473 airports).
- Wednesday 28 October, primary feed: 228 (135 dep / 93 arr), −9% against the 250 baseline and −12% against the four pre-event Wednesdays (237–284) — settled on the final refresh of 1 November; the late-ingest pass of 31 October added eight departures to the 220 published on 30 October; inside the 196–284 range of the pre-event days, but its lowest Wednesday since 18 September. Before 12:00 UTC it records 90 departures and 49 arrivals; from 20:00 UTC to midnight it records a single movement — a departure at 21:37 UTC added by that pass (last arrival 19:44 UTC) — where the same window held 7–15 movements on each of the other days from 11 to 27 October outside 17–19 October. Independent aggregate: 222 (104 dep / 118 arr), −12% against its 252 baseline and −14% against its four pre-event Wednesdays (237–266) — its lowest Wednesday since 18 September, though inside the 202–283 range of its 29 pre-event days, with departures and arrivals in balance and global collection at its usual level (472 airports).
- Thursday 29 October, primary feed: 166 (96 dep / 70 arr), −34% against the 250 baseline and −31% against the four pre-event Thursdays (218–254) — settled on the final refresh of 2 November; the late-ingest pass added ten departures to the 156 published here on 31 October; below the 196–284 range of the pre-event days and its lowest reading since 19 October. Before 12:00 UTC it records 48 departures and eight arrivals (Thursday 15 October: 90 and 40; morning arrivals ran 26–55 on every pre-event day); from 12:00 UTC, 48 and 62 (15 October: 53 and 56); from 20:00 UTC to midnight it records 16 movements, so the evening gap of 28 October did not repeat. Independent aggregate: 139 (65 dep / 74 arr), −45% against its 252 baseline and −40% against its four pre-event Thursdays (202–243) — below the 202–283 range of its 29 pre-event days and its lowest reading since 17 October, with departures and arrivals in balance and global collection at its usual level (462 airports).
- Friday 30 October, independent aggregate: 247 (117 dep / 130 arr), −2% against its 252 baseline — back inside the 202–283 range of its 29 pre-event days, though −10% against its four pre-event Fridays (268–283) — with global collection at its usual level (474 airports). Primary feed: 245 (139 dep / 106 arr), −2%, settled on the final refresh of 3 November.
- 31 October–6 November, primary feed (all settled): 229, 269, 264, 240, 197, 264, 259 — inside the 196–284 range of the pre-event days on every day; Wednesday 4 November at 197 (116 dep / 81 arr, −21%) is the low point. Independent aggregate: 204, 288, 276, 257, 238, 256 for 31 October–5 November and no row for 6 November; 31 October (−19%) is the only reading below its baseline by more than 6%, and it sits inside its 202–283 range.
- 7–9 November, primary feed (settled): 211 (139 dep / 72 arr, −16%), 186 (121 / 65, −26%), 150 (100 / 50, −40%) — arrivals falling faster than departures, the coverage-loss shape of 17–19 October. Independent aggregate: 242 and 259 on 7–8 November (inside its range), then 149 (71 / 78, −41%) on 9 November, 10 (9 / 1, −96%) on 10 November and 86 (39 / 47, −66%) on 11 November, with its global collection at its usual level (462–474 airports).
- 10–15 November, primary feed: no readable count. The feed's network-wide collection fell to 16–20 thousand departures a day worldwide, against 131–146 thousand on 1–9 November; at NBO it holds 37–73 departures and 0–5 arrivals a day. This is a collection failure across the whole feed, not a Nairobi signal, and we do not plot it.
- 12–15 November, independent aggregate: 241 (117 / 124, −4%), 202 (111 / 91, −20%), 106 (48 / 58, −58%) on Saturday 14 November and 266 (134 / 132, +6%) on Sunday 15 November — inside its 202–283 range and level with its four pre-event Sundays (251–273), with departures and arrivals in balance and global collection at its usual level (461 airports).
- Primary-feed coverage: arrivals at NBO fell from roughly 100 a day to 25 on 17 October and 3–4 a day on 18–19 October, while departures kept being recorded, then returned to 78 on 20 October. That asymmetry is a receiver-coverage pattern, not a traffic pattern, and the 20 October arrivals date its end. Global collection on the same feed was normal on 17–20 October, so the hole was local to the Nairobi area.
- No confirmed airspace closure, volcanic ash exposure or GNSS interference in the Kenya FIR (HKNA). Our FIR-level live-traffic test did flag HKNA as near-empty (its closure-shaped pattern) nineteen times between 18 Oct 13:15 and 19 Oct 11:45 UTC — the same window as the primary-feed hole — and once more in October: a single flag at 21:15 UTC on 28 October, on one aircraft against a seven-day average of 5.4 for that time of night, inside the evening window in which the primary feed records a single NBO movement that day. On 27 October at 18:00 UTC the consensus step of our detection layer wrote a low-confidence closure-event record (0.18 of 1) for the Kenya FIR covering 18–19 October, built from three of those flags, a weak reroute signal and a military-exercise notice for a 6-nautical-mile area about 180 km north of Nairobi below 7,800 ft (valid 17 October–17 November) — not a closure of NBO or its airspace; we treat it as an echo of the coverage hole, not corroboration. On 28 October at 22:00 UTC it wrote a second record at the same 0.18 for 28 October, built from that single overnight flag and the same notice; we read it the same way. In November the test flagged HKNA as near-empty eleven times between 7 November 18:45 UTC and 14 November 02:45 UTC, each on 0–1 aircraft against a seven-day average of 5.4–8.5 for that time of day, and the consensus step wrote two more records at the same 0.18: one for 7–11 November and one for 14 November, both built from those flags, the same military-exercise notice and a restricted-area notice west of Mombasa (2–16 November). Eight of the eleven flags fall on 10–14 November, when the primary feed's collection was failing network-wide, so we do not read them as corroboration. No flag has fired since 14 November 02:45 UTC. The daily GNSS interference ratio for HKNA stayed between 0 and 0.28% from 10 October through 15 November, the latest day in that feed (no row for 25 October).
The honest read: both feeds confirm a reduction of roughly half or more at Nairobi on Saturday 17 October, both still read a third to 40% below baseline on Tuesday 20 October, the independent feed is back at its baseline on 21–24 October, and the primary feed settled inside its normal range on 21–24 October (231, 247, 266, 236). On Sunday 25 October both feeds read 26–32% low: on the primary feed the shortfall is a morning gap with almost no arrivals — the 17–19 October coverage signature — while the independent feed shows it with arrivals and departures in balance. On Monday 26 October both feeds were back above baseline (280 on the primary feed, now settled; 290 on the independent feed) and on Tuesday 27 October both read inside their normal range (a settled 241, and 255), so the 25 October dip — settled at 186 on the primary feed — reads as a one-day event, and we do not attribute it. On Wednesday 28 October both feeds read low (222, −12%, and a settled 228, −9%): inside their normal day-to-day range, but the lowest Wednesday on each since 18 September, and the primary feed records a single NBO movement after 19:44 UTC that day. On Thursday 29 October both feeds read below their normal range — 139 on the independent feed (−45%, its deepest reading since 17 October, with arrivals and departures in balance) and a settled 166 on the primary feed (−34%), whose arrivals before 12:00 UTC are nearly absent, as on 25 October. On Friday 30 October both feeds were back inside their normal range (247, and a settled 245). We do not attribute the 28–29 October softness either. From 30 October to 6 November neither feed read below its normal range on any day it has a row; on 7–9 November the primary feed slid to 150 with its arrivals thinning first, and on 9–11 November the independent feed fell to 149, 10 and 86 — a third, deeper episode that neither feed can separate from a receiver-coverage loss around Nairobi. From 10 November the primary feed is unreadable everywhere, not just at NBO; the independent feed read 241, 202, 106 and 266 on 12–15 November. We do not attribute the November episode. For 18–19 October we cannot separate a traffic reduction from a loss of receiver coverage around Nairobi — both crowdsourced feeds rely on the same kind of local receivers, and the independent feed drops a couple of dozen of its ~470 airports on any given day, so its missing NBO rows are a gap, not a zero. We have no crowdsourced ADS-B coverage for Mombasa (MBA), Kenya's second-largest airport, so we cannot say from our own network whether this is regional or NBO-specific. Live view: NBO airport brief.
What it means for flights
A confirmed drop on 17 October, with a depth that differs by feed. Two independent ADS-B receiver networks both show Nairobi well below normal on Saturday 17 October: the primary feed settled at 132 movements (−47%), the cross-check at 98 (−61%). They split differently — 107 departures / 25 arrivals on the primary feed, 56 / 42 on the cross-check — so neither is a complete picture; each count is a floor, and the true level sits at or above the higher one. The first-pass primary reading of 68 published on 20 October was superseded by the final refresh, which is why this page now leads with 132 and keeps 98 as the independent reading.
On 18–19 October the primary feed was blind at Nairobi, so its lowest numbers are not traffic. The primary feed's arrival-side count at NBO collapsed from roughly 100 a day to 25 on 17 October and 3–4 a day on 18–19 October, while departures were still being recorded (66 on 18 October, 30 on 19 October). Every aircraft that lands must take off again, so a departures-only picture is a receiver-coverage signature, not a traffic signature. Between 13:00 UTC on 18 October and 13:00 UTC on 19 October the feed holds no NBO departure at all, and our FIR-level live-traffic test flagged the Kenya FIR as near-empty nineteen times in the same window. Global collection on the feed was normal on those days, so the hole was local. On 20 October arrivals returned (78 against a normal 96–117), which dates the end of the coverage loss. We plot the 69 and 34 because they were measured, and we label them for what they are: a floor from a feed with a hole in it.
What we have checked, and the limits of each check. Our multi-source detection layer looked for the three classes of operational signal that commonly explain drops of this size: (1) a confirmed airspace closure or restriction in the Kenya FIR (HKNA) — none; our notice set refreshed on 27–28 October for the first time since 4 October; at that refresh it held six notices in force for HKNA, none of which closes NBO or restricts its airspace — the two that came nearest are a military-exercise area about 180 km north of Nairobi below 7,800 ft, in force from 17 October, and a surveillance-radar maintenance shutdown at Jomo Kenyatta on 26–28 October, 06:00–14:00 UTC, during which the primary feed reads 280, 241 and 228 for 26–28 October (settled) and the independent feed 290, 255 and 222. It refreshed again on 31 October and again holds six HKNA notices, none closing NBO or its airspace: the military-exercise area is still in force, and the others are publication notices, procedure changes from 26 November and a restricted area west of Mombasa from 2 November. At its latest refresh, 16 November 09:32 UTC, it again holds six HKNA notices, none closing NBO or its airspace: the military-exercise area (to 17 November), the restricted area west of Mombasa (to 16 November 15:00 UTC), a Mombasa radar maintenance shutdown on 16–18 November, a notice checklist and the two procedure changes from 26 November. The set holds notices still in force, so one issued and withdrawn between refreshes is invisible to it; (2) volcanic ash exposure or an ash advisory affecting NBO — none; (3) GNSS interference in HKNA — the daily interference ratio stayed between 0 and 0.28% from 10 October to 15 November (no row for 25 October), the latest day in that feed, not flagged. The closure-shaped flags on 18–19 October produced no confirmed closure event — the one record the consensus step wrote for them on 27 October carries a confidence of 0.18 of 1 and rests on those flags, a weak reroute signal and the military-exercise notice — and one more fired in October: a single overnight flag at 21:15 UTC on 28 October, which the consensus step turned into a second 0.18 record resting on that flag and the same notice. Eleven flags between 7 and 14 November produced two further 0.18 records (7–11 November and 14 November), resting on those flags, the same notice and the restricted area west of Mombasa; eight of those flags fall on days the primary feed's collection was failing network-wide. That leaves causes our detection layer does not cover at this airport — weather (we have no reliable observation-to-disruption model for NBO), airline schedule changes, local security events, infrastructure maintenance — and a receiver-coverage loss around Nairobi, which the primary feed's own pattern says is part of what it showed on 17–19 October.
Saturday context: NBO does not have Perth's weekend pattern. Some airports show a deep weekly trough on Saturdays (Perth drops ~60% every Saturday — we have a separate page on that). Nairobi does not: across the six Saturdays from 5 September to 10 October, observed movements ranged from 196 to 256, averaging ~234. The 10 October Saturday at 196 was the lowest in that run but still within 22% of the baseline. Saturday 17 October at 132 (primary feed) and 98 (cross-check) is 43–58% below that Saturday average — this is not a weekday-rhythm artefact.
What we were watching, and how each test resolved. The tests set on 20–21 October have largely resolved: (1) the cross-check feed never ingested 18 or 19 October for NBO, read 151 (−40%) on 20 October, then 261, 259, 283 and 247 on 21–24 October — a return to ~250, which is the short-reduction outcome we set as the closing condition; (2) the primary feed's arrival-side count at NBO came back on 20 October (78), dating the end of the coverage loss, and its 173 that day (−31%) agrees with the cross-check that the reduction outlasted the weekend; (3) 18 and 19 October have settled at 69 and 34 and stay a floor, and 20 October has settled at 173; (4) the primary feed settled at 231, 247, 266 and 236 for 21–24 October (−8%, −1%, +6%, −6%) — inside the 196–284 range of the pre-event days, the same direction as the independent feed; (5) no operational notice or news signal matching a closure of NBO has surfaced; the low-confidence closure-event record written on 27 October for 18–19 October rests on the same near-empty flags and a military-exercise notice 180 km away, and a second one written on 28 October rests on a single overnight flag and the same notice. On that measured signal the 17–20 October episode reads as a four-day reduction of unattributed cause. A second test opened on Sunday 25 October: the independent feed read 171 (−32%) and the primary feed a provisional 186 (−26%), its shortfall confined to the hours before 12:00 UTC with almost no arrivals. The readings that followed resolve it: the independent feed read 290 on Monday 26 October (+15%) and 255 on Tuesday 27 October, and the primary feed settled at 280 (+12%) for 26 October with its morning arrivals back and 241 (−4%) for 27 October — a one-day dip, not a returning reduction; the primary feed's 25 October count settled at 186 on 29 October. The test opened by the independent feed's 222 on Wednesday 28 October (−12%) is answered on the primary feed: that day reads low there too, a settled 228 (−9%) — the lowest Wednesday on both feeds since 18 September, inside both normal ranges, with a single primary-feed movement at NBO after 19:44 UTC. The test opened on Thursday 29 October, when the independent feed read 139 (−45%), is answered on both counts: the primary feed settled that day at 166 (−34%) — below its normal range, with almost no arrivals before 12:00 UTC, the 25 October shape — and both feeds were back inside their normal ranges on Friday 30 October (247 independent, a settled 245 primary). 29 October reads as a second one-day dip, like 25 October. A third episode followed on 7–11 November and is set out in the next section; the primary feed cannot answer anything after 9 November, because its collection failed network-wide from 10 November.
What the data showed — closing this page on 16 November. Across 30 days of tracking, Nairobi's observed traffic fell three times and came back each time. (1) 17–20 October: 132 on the primary feed and 98 on the independent feed on 17 October (−47% and −61% against ~250), a primary-feed coverage hole on 18–19 October, and 173 and 151 on 20 October; from 21 October both feeds read inside their normal ranges. (2) One-day dips on 25 and 29 October: 186 and 166 on the primary feed (settled), 171 and 139 on the independent feed, each followed the next day by a reading inside the normal range. (3) 7–11 November: the primary feed slid to 211, 186 and 150 on 7–9 November with arrivals thinning first, and the independent feed fell to 149, 10 and 86 on 9–11 November. After that, the primary feed has no readable NBO count — its collection failed across its whole network from 10 November (16–20 thousand departures a day worldwide, against 131–146 thousand) — so the recovery reading rests on the independent feed alone: 241 on 12 November, 202 on 13 November, 106 on Saturday 14 November and 266 on Sunday 15 November (+6% against its 252 baseline), the last inside its 202–283 range and level with its four pre-event Sundays (251–273). Our FIR-level test has not flagged the Kenya FIR (HKNA) as near-empty since 14 November 02:45 UTC — 55 hours at close — and the four low-confidence (0.18 of 1) closure-event records written for HKNA over the period rest on those flags, a weak reroute signal (in the first record only) and notices that do not close NBO or its airspace. We close the page on that signal. What it cannot tell us: whether the November readings are fewer flights or fewer receivers — the independent feed's 10 on 10 November and 106 on 14 November came with its global collection at its usual level, so they are local, but both feeds depend on the same kind of receivers around Nairobi; and the primary feed's count for 10–15 November is a gap, not a zero. The cause of all three episodes is not attributed. If NBO drops again, it opens a new page; the live picture stays on the NBO airport brief.
Passenger questions, answered from the data
Our data shows observed traffic at Jomo Kenyatta International (NBO) fell 47–61% on Saturday 17 October 2026, depending on the feed, confirmed on two independent ADS-B networks; both feeds still read a third to 40% below baseline on Tuesday 20 October; from Wednesday 21 October the independent feed was back at its baseline and the primary feed within its normal range (settled at 231–266 for 21–24 October); on Sunday 25 October both feeds read 26–32% below baseline for one day, on Monday 26 October both were back above baseline, on 27–28 October both read inside the normal range, on Thursday 29 October both read below it (the independent feed 45% below baseline, the primary feed a settled 34%), and on Friday 30 October both feeds were back inside their normal range. A third episode on 7–11 November took the independent feed as low as 10 movements on 10 November; it read 266 on 15 November (+6% against baseline), and tracking on this page closed on 16 November. Our primary feed's coverage at NBO was degraded on 17–19 October, so its 18–19 October readings understate traffic, and it has no readable count from 10 November because of a collection failure across its whole network. No confirmed airspace closure or restriction in the Kenya FIR (HKNA). Check your airline's flight status for the latest on individual routes.
We do not have an attributed cause. Our detection layer checked for airspace closures (notice set refreshed 27–28 October after a gap since 4 October, and again on 31 October; it holds no notice closing NBO), volcanic ash and GNSS interference in the Kenya FIR (HKNA) — none confirmed. Part of what our primary feed showed on 17–19 October is a loss of receiver coverage around Nairobi, which we cannot separate from the traffic signal for 18–19 October. Possible explanations include weather, airline schedule changes, local events or infrastructure work, but we will not speculate beyond what the data shows. This page will update when more information emerges.
We publish the measured operational picture — observed traffic levels, closure signals and airspace hazards — not safety verdicts. Whether an airport or route is safe to operate is determined by the airline, the airport authority and the relevant regulators. If you have a flight booked, check your airline's status page for real-time updates.
For media — the full kit
Everything on this page — charts, CSV, quotes — is published under CC BY 4.0: free to reuse with attribution to FlySafe.zone. Charts come in dark (social/web) and light (print/light layouts) versions; attribution and license are embedded in every file.
“Observed traffic at Nairobi's Jomo Kenyatta International fell to between 98 and 132 movements on Saturday 17 October 2026 depending on the feed — 47 to 61% below its 250-movement daily baseline — on two independent ADS-B receiver networks, with both feeds still a third to 40% below baseline on 20 October, the independent feed back at baseline on 21–24 October, a one-day dip of 26–32% on both feeds on 25 October followed by readings above baseline on 26 October, and no confirmed airspace closure, volcanic ash or GNSS interference in the Kenya FIR, according to flight-monitoring service FlySafe.zone.”
Boilerplate — about the source (for your article footer)
FlySafe.zone monitors airspace risk and observed airport activity worldwide: 334 flight-information regions scored daily, GPS-interference signals, volcanic-ash exposure and daily observed movements at 493 airports from the crowdsourced ADS-B receiver network. Methodology: flysafe.zone/methodology.
Need a different cut of the data, a comment, or numbers for another airport? Leave an email — we answer fast during active events.