GPS Interference over North-East Hungary, October 2026: 63.5% of Aircraft Flag Degraded Navigation Around Miskolc on 16 October, the Cell's Highest Reading Since Monitoring Began, as Readings Peak from South-East Poland to the Romanian Border
- Budapest (BUD) is operating — observed movements averaged about 431/day across 16 September–11 October and read 436, 394, 426, 430, 453, 375, 444, 446, 379, 408, 446, 454, 394, 421, 442, 351, 382, 412, 450, 362, 417, 428, 321, 325, 388, 447, 336, 381 and 412 on 12 October–9 November (all settled, 3 November the lowest day in the window; 27 October has a one-hour collection hole; 10–13 November unreadable after a network-wide collection failure). Check your airline on the day.
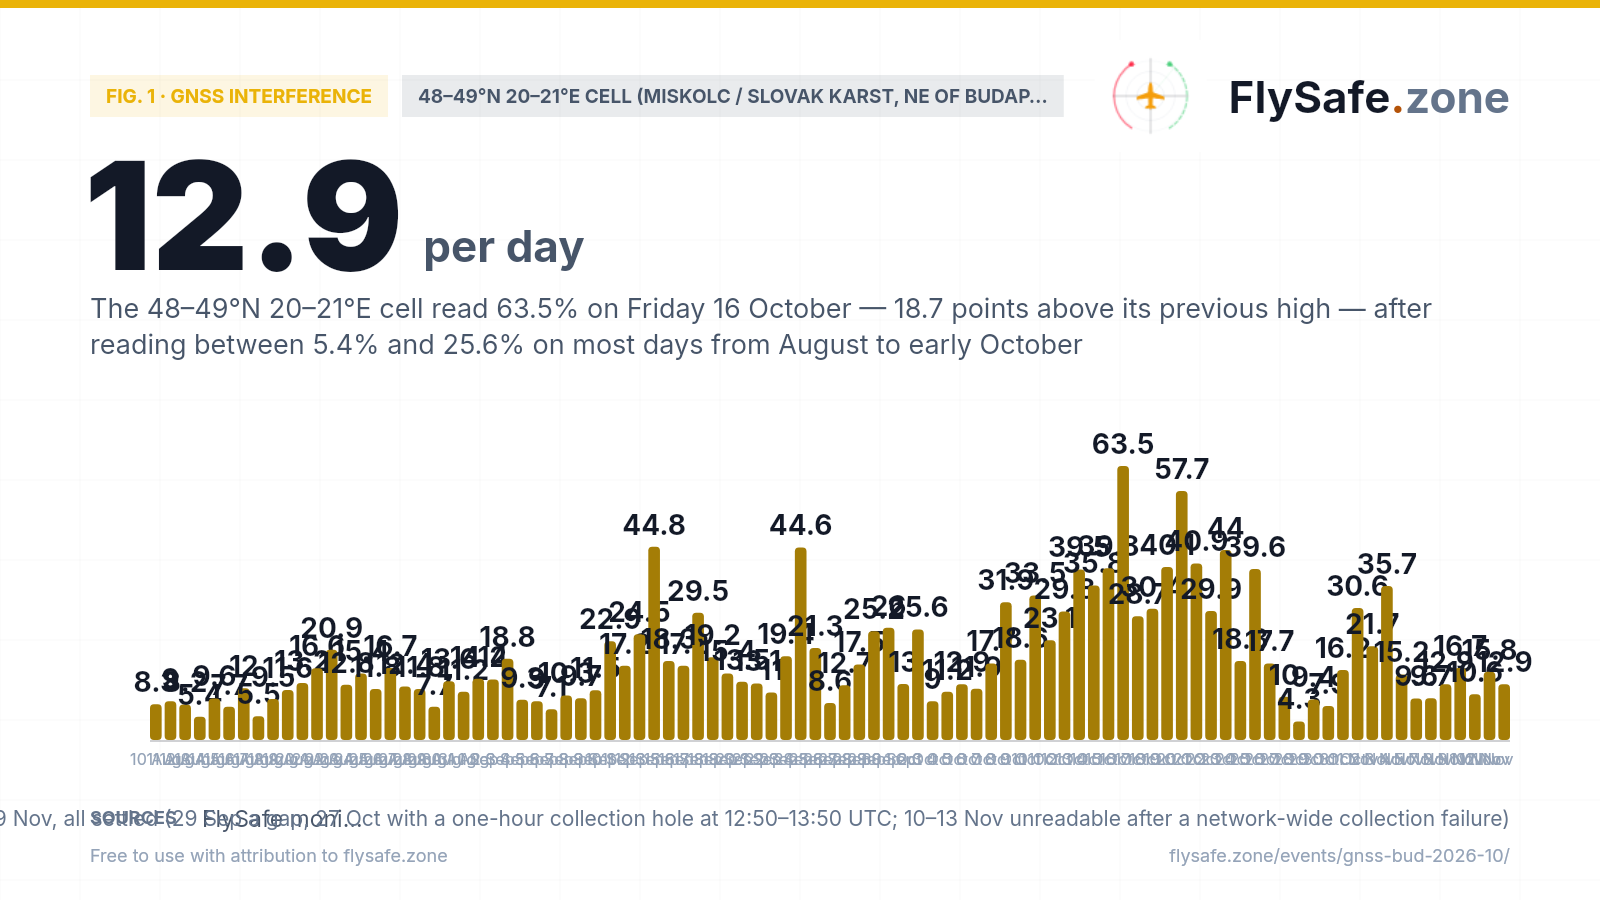
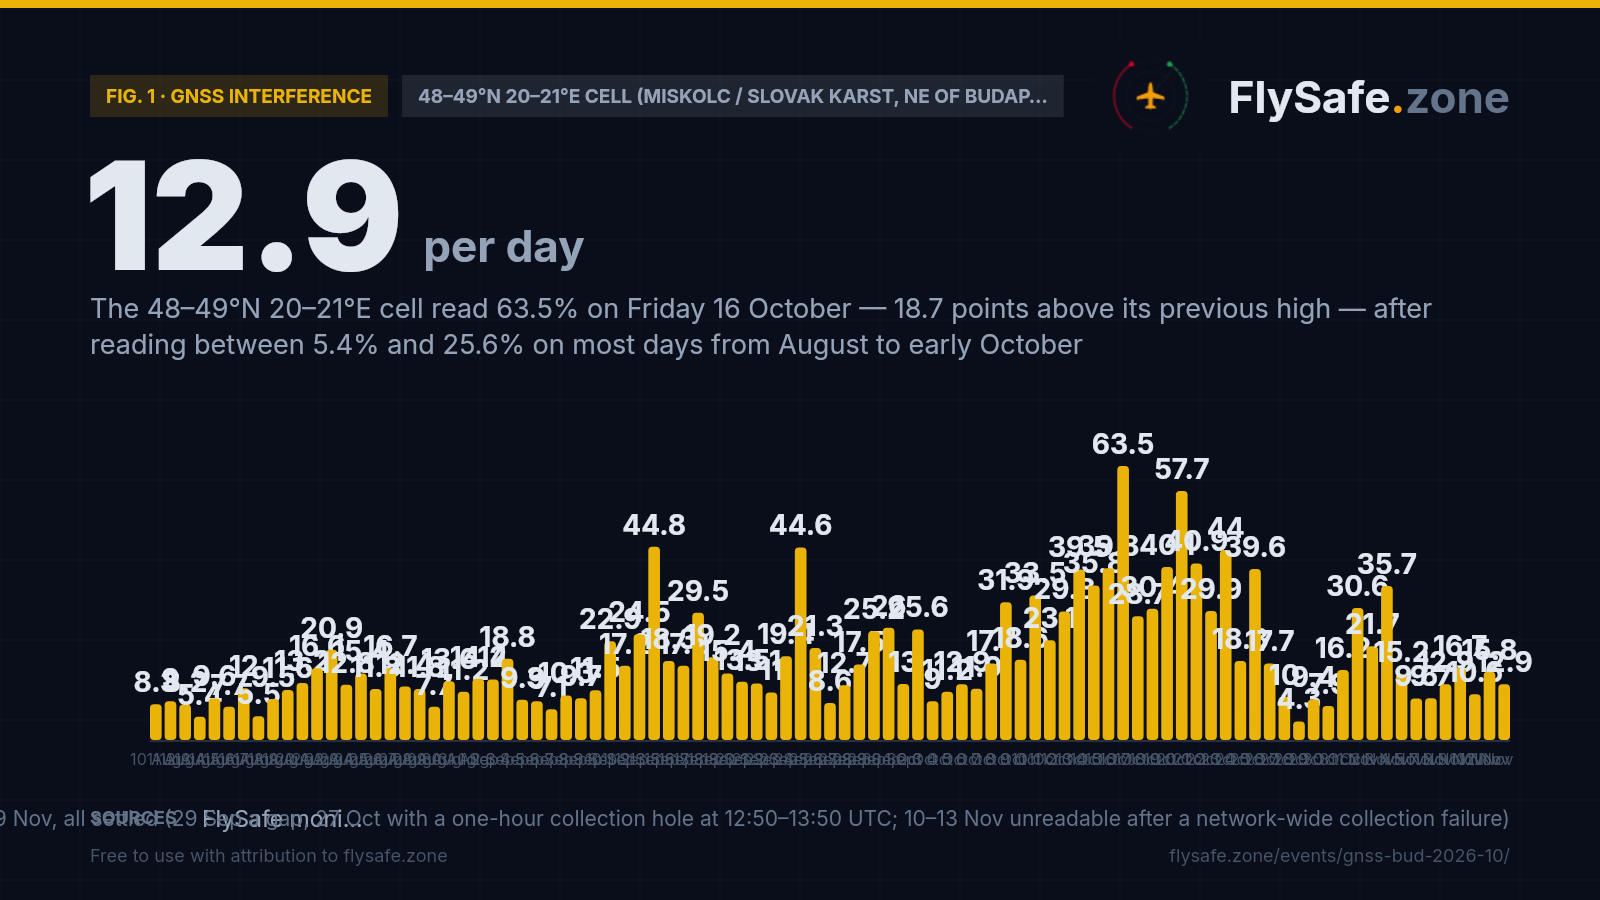
- North-east of the capital, over Miskolc and the Slovak border, 63.5% of tracked aircraft flagged degraded navigation on 16 October — the highest reading for that cell since monitoring began on 10 August, after a week-long climb from 18.6% on 9 October. It eased to 28.7% on 17 October, then rebounded to 30.4%, 40.1% and 57.7% on 18–20 October, then read 40.9% on 21 October, 29.9% on 22 October, 44.0% on 23 October, 18.3% on 24 October, 39.6% on 25 October, 17.7% on 26 October, 10.0% on 27 October, 4.3% on 28 October, the cell's lowest on record, on what was then its thinnest sample, 9.4% on 29 October, 7.9% on 30 October, 16.2% on 31 October, 30.6% on 1 November, the first day above the cell's August–September range since 25 October, 21.7% on 2 November, back inside it, 35.7% on 3 November, above it again, 15.2% on 4 November, back inside it, 9.6% on 5 November, below it, 9.7% on 7 November, below it again, 12.9% on 8 November, back inside it (6 November a gap), 16.7% on 9 November, inside it again, on the first sample of 250 aircraft or more since 31 October, 10.6% on 10 November, 15.8% on 11 November, on a thin sample, and 12.9% on 12 November, all inside it — two of the eleven observed days since 1 November above it, both on thin samples; the seven-day figure to 12 November is 13.2%, under the cell's September level and inside its August–September range, so the easing we called held and this brief is closed, while the cell just to the east, at 56–64% on 1–3 November and 21–23% on 4–5 November, read 34.5–38.3% on 7–12 November.
- Budapest's own airspace cell reads far lower: 15.3% on 16 October, 20.2% on 20 October, 5.0% on 30 October, 7.7% on 31 October, 12.0% on 1 November, 10.7% on 2 November, 11.5% on 3 November, 11.0% on 4 November, 9.7% on 5 November, 11.4% on 7 November, 10.1% on 8 November, 8.3% on 9 November, 6.9% on 10 November, 8.1% on 11 November, 6.3% on 12 November — 8.6% over the seven days to 12 November. The zone is a gradient that strengthens eastward: 21.3% at 18–19°E, 30.1% at 19–20°E, 63.5% at 20–21°E, 87.4% at 21–22°E and 96.0% at 22–23°E along 48–49°N. Debrecen's cell read 59.9%, Kraków's 46.3% — both their highest since August.
- GPS interference is a navigation-integrity issue, not a closure event — inertial systems and ground-based aids (ILS, VOR/DME) back satellite navigation up; the practical cost is precision and crew workload, occasionally a diversion in poor weather.
Advisory timeline — how active is this episode
Our detection layer reads the navigation-integrity field every ADS-B aircraft broadcasts — the Navigation Integrity Category, a self-reported measure of how far the aircraft trusts its own position. When satellite navigation is jammed or spoofed, receivers lower that figure, and the share of aircraft broadcasting a low NIC rises. The cell behind this brief is the 1°×1° box spanning 48–49°N, 20–21°E — north-east Hungary around Miskolc and the Bükk hills, and south-east Slovakia up to the Slovak Karst, its south-west corner about 85 km north-east of Budapest Liszt Ferenc; Košice sits just east of it. It carries 158–448 tracked aircraft a day. Friday 16 October read 63.5% (221 of 348 aircraft), the cell's highest reading in 93 observed days; the two previous highs, 44.8% on 13 September and 44.6% on 24 September, were one-day spikes that fell back to 18.3% and 21.3% on the next observed day. What is different this time is the sustained run: 29.8% → 39.5% → 35.8% → 39.8% → 63.5% → 28.7% → 30.4% → 40.1% → 57.7% → 40.9% → 29.9% → 44.0% → 18.3% → 39.6% → 17.7% → 10.0% → 4.3% → 9.4% → 7.9% → 16.2% → 30.6% → 21.7% → 35.7% → 15.2% → 9.6% → 9.7% → 12.9% → 16.7% → 10.6% → 15.8% → 12.9% across 12 October–12 November (6 November a gap), or 27.8% aggregated (2,366 of 8,512). The post-peak pull-back to 28.7% on 17 October lasted one day; Sunday 18 October read 30.4% (100 of 329), Monday 19 October 40.1% (126 of 314) and Tuesday 20 October 57.7% (221 of 383) — the same count of flagged aircraft as on the peak day, out of a larger sample, and the cell's second-highest reading on record; Wednesday 21 October read 40.9% (141 of 345), back to the level of 19 October, Thursday 22 October 29.9% (103 of 345), the lowest since the 28.7% of 17 October, Friday 23 October 44.0% (159 of 361), Saturday 24 October 18.3% (62 of 339) — the lowest since 17.7% on 7 October and back inside the August–September range for one day — Sunday 25 October 39.6% (111 of 280), Monday 26 October 17.7% (50 of 282), matching the 17.7% of 7 October, Tuesday 27 October 10.0% (24 of 240), the lowest since 9.0% on 3 October, Wednesday 28 October 4.3% (9 of 208), the lowest reading in the cell's record (the previous low was 5.4% on 13 August), on what was then the thinnest sample in the record, Thursday 29 October 9.4% (23 of 245), Friday 30 October 7.9% (20 of 253), Saturday 31 October 16.2% (45 of 278), up from 7.9% but still inside the August–September range — six consecutive days at or below that range — Sunday 1 November 30.6% (72 of 235), the first reading above that range since 25 October, on a thin sample, Monday 2 November 21.7% (46 of 212), back inside it, Tuesday 3 November 35.7% (80 of 224), above it again and the highest reading since 25 October, Wednesday 4 November 15.2% (30 of 198), back inside it, on what was then the thinnest sample in the record, Thursday 5 November 9.6% (20 of 208), below it, the lowest since 30 October, on a sample then tied for the second-thinnest, Saturday 7 November 9.7% (23 of 238), below it again, Sunday 8 November 12.9% (27 of 209), back inside it, on what was then the fourth-thinnest, Monday 9 November 16.7% (51 of 306), inside it again, on the largest sample since 24 October and the first of 250 aircraft or more since 31 October, Tuesday 10 November 10.6% (21 of 199), inside it again, on what was then the second-thinnest sample in the record, Wednesday 11 November 15.8% (25 of 158), inside it again, on the thinnest sample in the record, and Thursday 12 November 12.9% (34 of 264), inside it again, on an ordinary sample; 2 and 3 November came on what were then the fourth- and fifth-thinnest, and 6 November is a gap in our per-cell feed. Fifteen of the thirty-one observed days since 12 October have read above 28%, and twelve of them above 30%. The longer record is a slow climb: 11.6% across 10–31 August (839 of 7,254), 18.6% across September (1,777 of 9,579, 29 observed days) and 18.8% across 1–11 October (657 of 3,491). The rolling seven-day figure is 13.2% (181 of 1,374, six observed days) to 12 November, under the cell's 18.6% September level and inside its August–September range, after 12.7% (167 of 1,318, six observed days) to 11 November and 12.7% (172 of 1,358, six observed days) to 10 November, the lowest since 11 September, as the 35.7% of 3 November left the window, after 16.7% (231 of 1,383, six observed days) to 9 November, 17.5% (226 of 1,289, six observed days) to 8 November, 20.6% (271 of 1,315, six observed days) to 7 November, the highest since 29 October, 19.5% (313 of 1,608) to 5 November, 19.2% (316 of 1,645) to 4 November, 17.8% (295 of 1,655) to 3 November, 14.3% (239 of 1,671) to 2 November and 14.0% (243 of 1,741) to 1 November, then the lowest since 11 September — the 30.6% day did not lift it because the 39.6% of 25 October left the window — 15.8% (282 of 1,786) to 31 October, level with the 15.8% to 9 October, 16.2% (299 of 1,847) to 30 October, 22.4% (438 of 1,955) to 29 October, 25.2% (518 of 2,055) to 28 October, 29.7% (650 of 2,192) to 27 October — the first reading under 30% since 14 October, now that both the 63.5% peak day and the 57.7% of 20 October have left the window — and 36.3% (847 of 2,335) to 26 October; it had read above 30% on every day of 14–26 October, up from 15.8% to 9 October. Our automated threshold compares each cell with the same cell seven days earlier — here 12 October, 29.8% — and in this case the longer record agrees that the level is new for the cell. 14 September and 6 November are gaps in our per-cell feed and are left out of the chart, not plotted as zero.
Fig. 1 — daily share of tracked aircraft broadcasting a low Navigation Integrity Category (NIC) in the 48–49°N 20–21°E cell (north-east Hungary / south-east Slovakia), % — crowdsourced ADS-B network; 14 Sep and 6 Nov collection gaps · Data as of 14 Nov 2026, 03:50 UTC · closed · per-cell series complete through 12 Nov (14 Sep and 6 Nov gaps), FIR-level through 12 Nov, traffic through 9 Nov, all settled (29 Sep a gap, 27 Oct with a one-hour collection hole at 12:50–13:50 UTC; 10–13 Nov unreadable after a network-wide collection failure) · Source: FlySafe monitoring — crowdsourced ADS-B navigation-integrity data (public).
Airports in the exposure zone
| Airport | Size | Distance from cell centre · exposure (12 Nov) | FIR |
|---|---|---|---|
| Debrecen (DEB) | medium | 140 km · own cell 47–48°N 21–22°E ≈15.3% flagged (59 of 385; 16.2% over 7 days) — below its 59.9% high of 16 Oct | LHCC |
| Budapest Liszt Ferenc (BUD) | large | 150 km · own cell 47–48°N 19–20°E ≈6.3% flagged (46 of 734; 8.6% over 7 days) · 412 movements on 9 Nov (settled) | LHCC |
| Kraków John Paul II (KRK) | large | 183 km · own cell 50–51°N 19–20°E ≈11.5% flagged (37 of 321; 15.7% over 7 days) — down from 49.5% on 20 Oct | EPWW |
| Oradea (OMR) | small | 195 km · shares Debrecen's cell 47–48°N 21–22°E — ≈15.3% flagged | LRBB |
| Rzeszów-Jasionka (RZE) | medium | 210 km · own cell 50–51°N 22–23°E — 59 of 103 aircraft flagged (57.3%; thinner sample; 61.6% over 7 days) | EPWW |
Distance alone does not determine impact — wind direction and the flight levels the ash reaches decide which airports and routes are affected on a given day. FIR = Flight Information Region.
What our monitoring shows: Budapest traffic through the climb
FlySafe tracks observed departures and arrivals at 493 airports from crowdsourced ADS-B receiver data. Observed counts are a floor, not a total — receiver coverage varies — but an airport measured against its own baseline is a reliable shape. Budapest Liszt Ferenc's last 30 days:
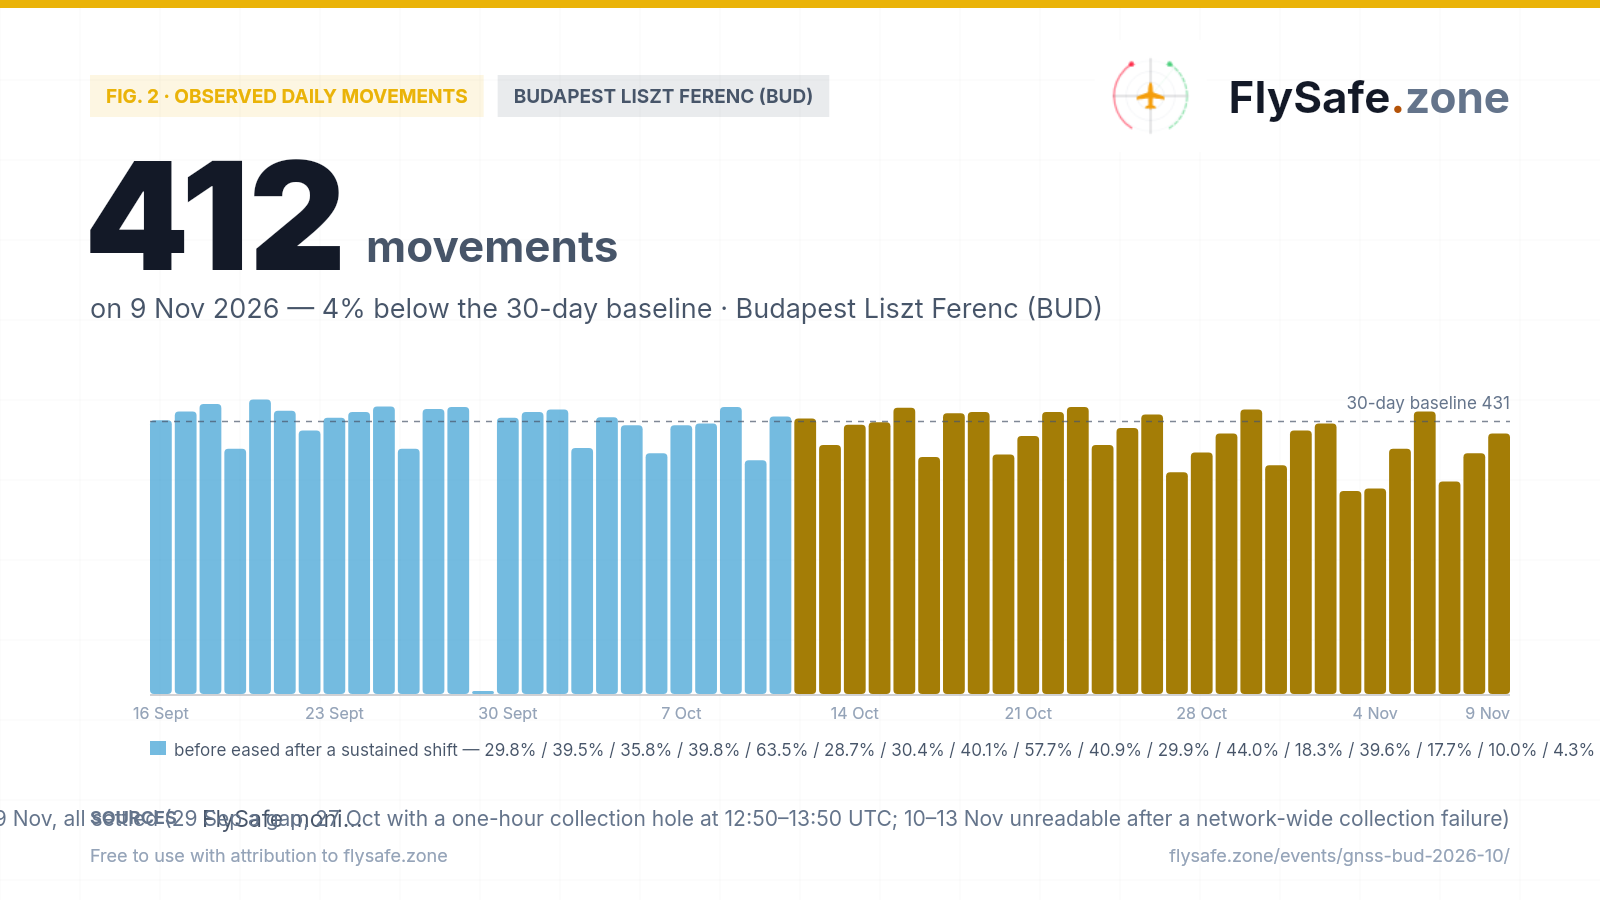
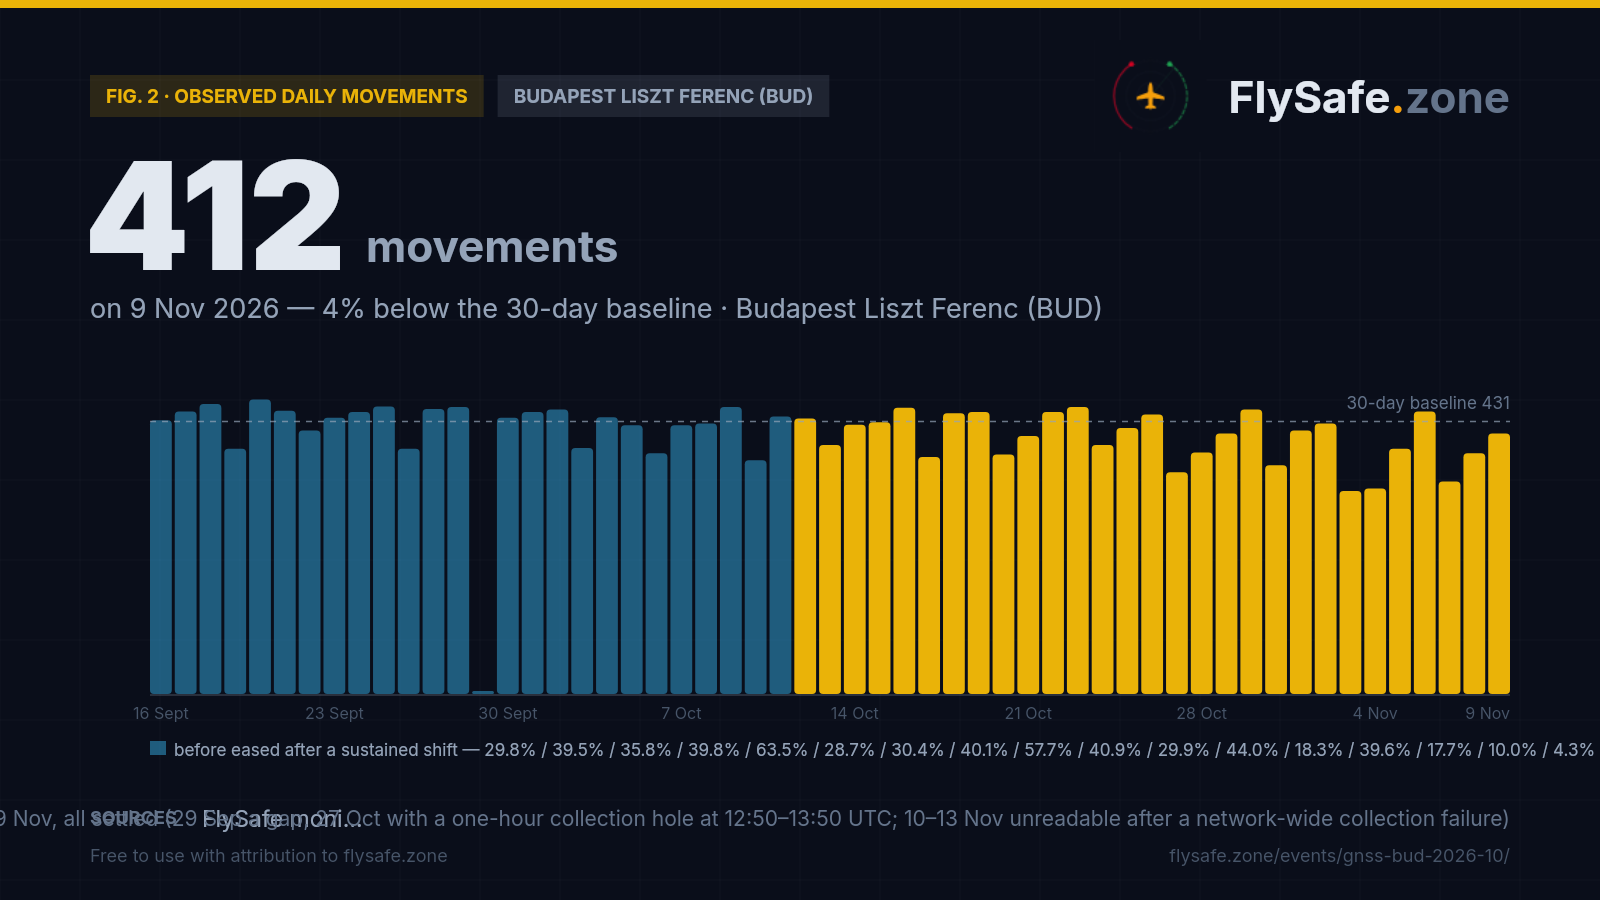
Fig. 2 — Observed daily movements at BUD, 16 Sept – 9 Nov (latest complete UTC day). Data as of 14 Nov 2026, 03:50 UTC · closed · per-cell series complete through 12 Nov (14 Sep and 6 Nov gaps), FIR-level through 12 Nov, traffic through 9 Nov, all settled (29 Sep a gap, 27 Oct with a one-hour collection hole at 12:50–13:50 UTC; 10–13 Nov unreadable after a network-wide collection failure) · Source: FlySafe monitoring (ADS-B receiver network).
- Across 16 September–11 October (25 plotted days) Budapest Liszt Ferenc averaged ~431 observed movements a day — the reference line on the chart. Since the cell's readings rose, 12 October–9 November read 436 / 394 / 426 / 430 / 453 / 375 / 444 / 446 / 379 / 408 / 446 / 454 / 394 / 421 / 442 / 351 / 382 / 412 / 450 / 362 / 417 / 428 / 321 / 325 / 388 / 447 / 336 / 381 / 412. Observed counts are a floor, not a total.
- Monday 9 November — 412 movements (207 departures, 205 arrivals) — is the last day plotted, settled, the stored total agreeing with the figure we first published; it is 4% under the window average and 7% under the Monday reference at the time, and the window's lowest Monday by 13 movements (earlier Mondays 448, 454, 425, 436, 446, 442 and 428); the second crowdsourced network we use as a cross-check read it at 412 movements, against 420 on Monday 2 November. We report the figure and do not attribute it. 10–13 November are not plotted: our traffic feed collected a small fraction of its usual worldwide volume on those days (about 18,000 takeoffs a day, against about 136,000 on 9 November), so BUD's stored 17, 16, 33 and 27 movements are a collection failure, not a reading; the cross-check network read BUD at 276, 293 and 371 movements on 10–12 November, which we report and do not plot or attribute. Sunday 8 November settled at 381 (191/190), the stored total now agreeing with the recount we plotted — three movements more than the 378 we first published; 381 is 12% under the window average and 13% under the Sunday reference at the time, the window's lowest Sunday by 36 movements (earlier Sundays 466, 451, 438, 439, 444, 421 and 417); the cross-check network read it at 378 movements, against 406 on 1 November. Saturday 7 November settled at 336 (180/156), the stored total now agreeing with the recount we plotted — five movements more than the 331 we first published; it is the window's lowest Saturday (earlier Saturdays 388, 388, 389, 370, 375, 394 and 362) and its third-lowest day of any kind, after the 321 and 325 of 3–4 November, 22% under the window average and 10% under the Saturday reference at the time; the cross-check network read it at 318 movements, against 353 on 31 October. Friday 6 November settled at 447 (225/222), the stored total now agreeing with the recount we plotted — seven movements more than the 440 we first published; it is the window's lowest Friday by three movements (earlier Fridays 459, 455, 450, 454, 453, 454 and 450), 4% over the window average and 1% under the Friday reference; the cross-check network has no 6 November figure — that day is missing from its feed at every airport. Thursday 5 November settled at 388 (199/189), the stored total now agreeing with the recount we plotted — seven movements more than the 381 we first published; it is the window's lowest Thursday (earlier Thursdays 447, 446, 446, 428, 430, 446 and 412), 10% under the window average and 10% under the Thursday reference at the time; the cross-check network read it at 376 movements, against 397 on Thursday 29 October. Wednesday 4 November settled at 325 (174/151), the stored total now agreeing with the recount we plotted — eight movements more than the 317 we first published; it is the window's lowest Wednesday (earlier Wednesdays 433, 437, 437, 425, 426, 408 and 382) and its second-lowest day of any kind, 25% under the window average and 24% under the Wednesday reference at the time; the cross-check network read it at 311 movements. Tuesday 3 November settled at 321 (168/153), the stored total now agreeing with the recount we plotted and with the figure we first published; it is the window's lowest day of any kind and its lowest Tuesday (earlier Tuesdays 417, 381, 394, 379 and 351), 26% under the window average and 16% under the Tuesday reference; the cross-check network read it at 300 movements, against 420 on 2 November. We report the figures and do not attribute them. Monday 2 November settled at 428 (217/211), the stored total now agreeing with the recount we plotted — four movements more than the 424 we first published; it is the window's second-lowest Monday after the 425 of 5 October (earlier Mondays 448, 454, 425, 436, 446 and 442), 1% under the window average and 3% under the Monday reference; the cross-check network read it at 420 movements. Sunday 1 November settled at 417 (212/205), the stored total now agreeing with the recount we plotted — four movements more than the 413 we first published; it is the window's lowest Sunday (earlier Sundays 466, 451, 438, 439, 444 and 421), 3% under the window average and 5% under the Sunday reference; the cross-check network read it at 406 movements. Saturday 31 October settled at 362 (191/171), the stored total now agreeing with the recount we plotted; it is the window's lowest Saturday (earlier Saturdays 388, 388, 389, 370, 375 and 394), 16% under the window average, and the cross-check network also read the day low (353 movements, against 381 on 24 October). We report the figures and do not attribute them. Friday 30 October settled at 450 (233/217), the stored total agreeing with the figure we first published, in line with the window's earlier Fridays (459, 455, 450, 454, 453 and 454). Thursday 29 October settled at 412 (213/199), the stored total now agreeing with the recount we plotted — five movements more than the 407 we first published; its 21:00 UTC hour stayed light (5 movements, against 10–19 on 26–28 and 30 October). 412 is the window's lowest settled Thursday (earlier Thursdays 447, 446, 446, 428, 430 and 446), 4% under the window average and 8% under the Thursday reference at the time; the cross-check network read the day at 397 movements. 29 October fell in the first week of the airlines' winter schedule season; we report the figure and do not attribute it. Wednesday 28 October settled at 382 (198/184), the stored total now agreeing with the recount we plotted — one departure more than the 381 we first published; it remains the window's lowest settled Wednesday (earlier Wednesdays 433, 437, 437, 425, 426 and 408), 11% under the window average, and the cross-check network also read the day low (363 movements). Tuesday 27 October settled at 351 (184/167), the stored total now agreeing with the recount we plotted — four movements more than the 347 we first published. The network-wide collection hole at 12:50–13:50 UTC that day was not filled before the day settled — BUD's 13:00 UTC hour holds 13 movements, against 30 on 26 October and 26 on 28 October — so 27 October stays labelled partial. The hole does not account for the whole dip: the cross-check network also reads the day low (338 movements). 351 is the window's lowest settled Tuesday (earlier Tuesdays 417, 381, 394 and 379), 19% under the window average. Monday 26 October settled at 442 (230/212), the stored total now agreeing with the recount we plotted — five movements more than the 437 we first published, and inside the range of the window's earlier Mondays (448, 454, 425, 436 and 446), 3% over the window average. Sunday 25 October settled at 421 (215/206), the stored total now agreeing with the recount we plotted — eight movements more than the 413 we first published; it remains the window's lowest Sunday (earlier Sundays 466, 451, 438, 439 and 444), 2% under the window average; 25 October was also the first day of the airlines' winter schedule season, so the coming Sundays are the cleaner comparison, and we do not attribute the dip. Saturday 24 October settled at 394 (208/186), the stored total now agreeing with the recount we plotted — eight movements more than the 386 we first published, and in line with, slightly above, the window's earlier Saturdays (388, 388, 389, 370 and 375). Friday 23 October settled at 454 (236/218), the stored total now agreeing with the recount we plotted — four departures more than the 450 we first published, and in line with the window's earlier Fridays (459, 455, 450, 454 and 453). Thursday 22 October settled at 446 (230/216), the stored total now agreeing with the recount we plotted — six departures more than the 440 we first published, and in line with the window's earlier Thursdays (447, 446, 446, 428 and 430). Wednesday 21 October settled at 408 (213/195), the stored total now agreeing with the recount we plotted — the window's lowest settled Wednesday (earlier Wednesdays 433, 437, 437, 425 and 426) and 5% under the window average. Tuesday 20 October settled at 379 (192/187), three departures above the 376 we first published; it settled below the window's earlier Tuesdays (417, 381 and 394; 29 September is excluded as a gap), and 27 October has since settled lower. Monday 19 October settled at 446 (231/215) — we had first published that day at 440, which is why we do not call a two- or three-day-old figure final. Sunday 18 October settled at 444 (230/214), Saturday 17 October at 375 (201/174) and Friday 16 October at 453 (240/213), 5% over the window average.
- Two data notes. Tuesday 29 September is left as a gap — an empty slot, not a reading — because our collection that day has a hole at 13:00–15:00 UTC (2 and 2 BUD movements against 28 and 22 a week earlier). Thursday 15 October is plotted at 430 (223/207), the recount from individual flight records; the stored series has since confirmed it at 430.
- We do not attribute any traffic movement to the interference. Monday–Friday of the week of 12 October totalled 2,139 movements (on settled and recount figures), slightly above the 2,113 of the week of 5 October — when the cell read 12–32% — and 2.9% below the 2,203 of the week of 21 September. The full week of 12–18 October, including the Saturday and Sunday recounts, totalled 2,958 against 2,922 for the week of 5 October and 3,042 for the week of 21 September. Monday–Friday of the week of 19 October totalled 2,133 on settled figures, against 2,139 for the week of 12 October and 2,113 for the week of 5 October; the full week of 19–25 October totals 2,948 with the Sunday recount, against 2,958 for the week of 12 October and 2,922 for the week of 5 October. Monday–Friday of the week of 26 October, the first full week of the airlines' winter schedule season, totalled 2,037 on settled figures — 27 October with its collection hole — 4.5% under the 2,133 of the week of 19 October; the full week of 26 October–1 November totals 2,816 with the Sunday recount, 4.5% under the 2,948 of the week of 19–25 October. Monday–Friday of the week of 2 November totalled 1,909 on settled figures, 6.3% under the 2,037 of the week of 26 October; the full week of 2–8 November totals 2,626 with the Sunday recount, 6.7% under the 2,816 of the week of 26 October–1 November. The softer October weekdays began before the climb, and GNSS degradation is a navigation-integrity problem that crews fly through on back-up systems; it does not normally remove flights from a schedule.
What it means for flights
The news is the westward reach. Eastern Europe has carried elevated GNSS interference since the war in Ukraine began (background: how GPS jamming works), and the readings have been strongest along the Ukrainian border throughout our record — at 48–49°N, the 22–23°E cell went from 19.8% in late August to 30.3% in September and 30.4% over the seven days to 31 October. The 48–49°N, 20–21°E cell sat at the quiet end of that gradient: 11.6% in late August, 18.6% in September. What 16 October adds is that the high readings reached it. Along 48–49°N the day read 21.3% at 18–19°E, 30.1% at 19–20°E, 63.5% at 20–21°E, 87.4% at 21–22°E and 96.0% at 22–23°E; one row north the same step runs 41.1% → 78.1% → 91.7%. Across the box from 45–51°N and 16–25°E, 21 of 46 cells set their highest reading since 10 August (counting days with at least 100 tracked aircraft), concentrated from 20°E eastward and along 49–51°N as far west as 17°E, past Kraków. Between 46–50°N and 17–23°E, no cell read 60% or more on any day of 1–7 October; four did on 8 October, three to five on each day of 12–15 October, and seven on 16 October. We report the pattern; we do not attribute its source.
What it means for flights. A low NIC tells us an aircraft's satellite-derived position is less trustworthy than normal, not that the aircraft is off course. Airliners blend GNSS with inertial reference systems and ground-based navaids, and Budapest's runways have instrument landing systems that do not depend on satellites. Where interference bites is precision and workload: RNP approaches that need GNSS may be unavailable, crews cross-check more, and terrain or traffic warnings that rely on GNSS position can misbehave. Most aircraft in the 48–49°N cell are overflights rather than Budapest arrivals, and Budapest's own cell read 15.3% on 16 October, 20.2% on 20 October, 9.2% on 26 October, 7.7% on 27 October, 5.6% on 28 October, 5.4% on 29 October, 5.0% on 30 October, 7.7% on 31 October, 12.0% on 1 November, 10.7% on 2 November, 11.5% on 3 November, 11.0% on 4 November, 9.7% on 5 November, 11.4% on 7 November, 10.1% on 8 November, 8.3% on 9 November, 6.9% on 10 November, 8.1% on 11 November and 6.3% on 12 November. We make no call on whether to fly — that belongs to the operator and the regulator. Our NOTAM set, refreshed on 14 November, carries no rows for the Budapest or Bratislava FIRs, so we cannot report what Hungarian or Slovak authorities have or have not published on GNSS reliability; check current NOTAMs for LHCC and LZBB through official channels.
How to read the numbers on this page. Every percentage here is the share of tracked aircraft in a 1°×1° cell that broadcast a low NIC at least once that day — a floor, not a total, because our receivers do not see every aircraft. Cells with about 100 aircraft a day (Rzeszów's) swing more than cells with several hundred and are marked as thinner samples. The FIR-level figures are a different, region-wide measure: the Budapest FIR (LHCC) read 0.31% across 14,001 aircraft on 12 November, 0.36% across 13,598 on 11 November, 0.28% across 13,232 on 10 November, 0.26% across 15,164 on 9 November, 0.27% across 15,614 on 8 November, 0.53% across 15,373 on 7 November, 0.28% across 15,851 on 6 November, 0.26% across 15,358 on 5 November, 0.21% across 14,571 on 4 November, 0.51% across 14,388 on 3 November, 0.49% across 16,094 on 2 November and 0.69% across 17,506 on 1 November, under its 90-day high of 1.22% on 21 October (0.31% on 31 October, 0.13% on 30 October; the earlier high was 1.02% on 7 August), with monthly means of 0.19% in July, 0.25% in August, 0.34% in September and 0.54% in October; the Bratislava FIR (LZBB) read 1.37% across 4,609 aircraft on 12 November, 1.28% across 3,680 on 11 November, 1.11% across 3,879 on 10 November, 0.68% across 5,029 on 9 November, 1.03% across 4,551 on 8 November, 0.68% across 4,692 on 7 November, 1.40% across 4,714 on 6 November, 0.27% across 4,747 on 5 November, its lowest since 5 October, 0.47% across 4,277 on 4 November, 2.04% across 3,679 on 3 November, 1.47% across 4,223 on 2 November and 2.54% across 4,725 on 1 November, under the 90-day high of 3.43% it set on 20 October (1.47% on 31 October, 0.38% on 30 October), with monthly means of 0.34%, 0.50%, 0.83% and 1.61%; 25 October is missing from the FIR feed. They are not comparable to a single cell's share. Collection gaps are marked rather than filled: 14 September and 6 November in the per-cell feed, 29 September in BUD's traffic count, and 10–13 November, unreadable in our traffic feed after a network-wide collection failure; 27 October's traffic count is plotted with a one-hour hole at 12:50–13:50 UTC and labelled as such.
What would change our reading. The cell's two earlier spikes, 44.8% on 13 September and 44.6% on 24 September, fell back to around 20% the next observed day, so one day at 63.5% does not by itself set a new level. The next seven days, 17–23 October, read 28.7%, 30.4%, 40.1%, 57.7%, 40.9%, 29.9% and 44.0% — all above the 18–21% those earlier spikes fell back to, the fourth the cell's second-highest reading on record. Saturday 24 October then read 18.3% (62 of 339), the lowest since 7 October and inside the 10–25% band, Sunday 25 October 39.6% (111 of 280), Monday 26 October 17.7% (50 of 282), back inside the band, Tuesday 27 October 10.0% (24 of 240), at the band's floor, Wednesday 28 October 4.3% (9 of 208), below it — the lowest reading in the cell's record — Thursday 29 October 9.4% (23 of 245), below it again, Friday 30 October 7.9% (20 of 253), below it again, Saturday 31 October 16.2% (45 of 278), back inside it, and Sunday 1 November 30.6% (72 of 235), above it. We set a condition: call it a sustained shift if the seven-day figure holds above 30% through the week of 19 October on ordinary samples of 250 aircraft or more. That condition is met. The seven-day figure read between 37.7% and 43.5% on every day of 19–25 October, and above 30% on every day of 14–26 October; every daily sample that week was 280 aircraft or more, and the week aggregates 39.0% (923 of 2,367), about double the cell's 18.6% September level. We call this a sustained shift in the cell's level, not a one-day spike. We said we would call an easing if daily readings returned to the 10–25% band of August–September, or fell below it, for several days. That condition is now met. 26–30 October read 17.7%, 10.0%, 4.3%, 9.4% and 7.9%, five consecutive days at or below the band, and 24 October makes six in seven. Because 27, 28 and 29 October came on samples of 240, 208 and 245 aircraft — at the time three of the four thinnest in the cell's record, under the 250-aircraft floor we set for the sustained-shift call — we held the easing call to the same standard and waited for one more day at or below the band on an ordinary sample of 250 aircraft or more. Friday 30 October gave it: 7.9% (20 of 253), alongside Monday 26 October's 17.7% on 282 aircraft. The seven-day figure to 30 October is 16.2% (299 of 1,847), the lowest since 9 October and under the cell's 18.6% September level, after 22.4% (438 of 1,955) to 29 October and 29.7% (650 of 2,192) to 27 October, the first reading under 30% since 14 October. We call an easing: after the sustained shift of mid-to-late October, the cell's readings are back at or below their August–September level. Saturday 31 October read 16.2% (45 of 278), up from 7.9% but inside the band — a sixth consecutive day at or below it, on an ordinary sample — and the seven-day figure to 31 October is 15.8% (282 of 1,786). Readings rose across the region that day: 47.1% (202 of 429) in the cell to the east, at 21–22°E, up from 13.1%, 70.6% in Rzeszów's thinner cell, and 1.47% FIR-level in the Bratislava FIR, up from 0.38%. One day does not undo the easing; if this cell reads above the band for several days on ordinary samples, we will say so. Sunday 1 November then read 30.6% (72 of 235) — the first day above the band since 25 October, on a thin sample, under the 250-aircraft floor we apply to both calls — and the regional rise continued: 57.1% (193 of 338) in the cell to the east, 33.0% (113 of 342) in Kraków's cell, up from 15.6%, and 2.54% FIR-level in the Bratislava FIR, its highest since 23 October. The seven-day figure to 1 November is 14.0% (243 of 1,741), the lowest since 11 September, because the 39.6% of 25 October left the window. One day above the band on a thin sample is not several, so the easing call stands. Monday 2 November read 21.7% (46 of 212), back inside the band, and Tuesday 3 November 35.7% (80 of 224), above it again and the highest reading since 25 October — two of the last three days above the band, both on samples under the 250-aircraft floor, which six of the last eight days have now fallen under (2 and 3 November were, at the time, the second- and third-thinnest samples in the cell's record). The seven-day figure, which pools those thin days, rose to 17.8% (295 of 1,655) to 3 November from 14.3% (239 of 1,671) to 2 November — the highest since 29 October, and still under the cell's 18.6% September level. Next door the rise has held: the cell to the east read 47.1%, 57.1%, 56.1% and 64.4% (226 of 351) across 31 October–3 November, its highest since 23 October, Debrecen's cell 35.9% (112 of 312) on 3 November, its highest since 25 October, and the Bratislava FIR 2.04% FIR-level. Wednesday 4 November then read 15.2% (30 of 198), back inside the band, on what was then the thinnest sample in the cell's record; six of the last eight days are still under the 250-aircraft floor. The seven-day figure to 4 November is 19.2% (316 of 1,645), up from 17.8% as the 4.3% of 28 October left the window — the highest since 29 October and just above the cell's 18.6% September level, but inside the band and under the 25% line of our test. The regional readings fell back on 4 November: 22.5% (84 of 374) in the cell to the east, its lowest since 30 October, 13.9% (47 of 339) in Debrecen's cell, 15.3% (45 of 295) in Kraków's, and 0.47% FIR-level in the Bratislava FIR. The easing call stands on the test we set; if this cell reads above the band for several days on ordinary samples, or its seven-day figure climbs back above the band, we will say the easing has not held. Thursday 5 November read 9.6% (20 of 208), below the band and the lowest since 30 October, on a sample then tied for the second-thinnest in the record — the fifth day running under the 250-aircraft floor. The seven-day figure to 5 November is 19.5% (313 of 1,608), barely changed as the 9.4% of 29 October left the window — the highest since 29 October, still inside the band and under the 25% line. Next door, the cell to the east read 21.4% (87 of 407), its lowest since 30 October, Debrecen's cell 12.1% (40 of 331), Kraków's 18.4% (66 of 359), and the Bratislava FIR 0.27% FIR-level, its lowest since 5 October. The easing call stands. Friday 6 November is missing from our per-cell feed. Saturday 7 November read 9.7% (23 of 238), below the band again, and Sunday 8 November 12.9% (27 of 209), back inside it — every observed day since 1 November, seven in a row, has come on a sample under the 250-aircraft floor. The seven-day figure, pooled over six observed days because 6 November is missing, rose to 20.6% (271 of 1,315) to 7 November as the 7.9% of 30 October and the 16.2% of 31 October left the window — the highest since 29 October — then fell to 17.5% (226 of 1,289) to 8 November as the 30.6% of 1 November left it, back under the cell's 18.6% September level; both are inside the band and under the 25% line. Next door, the cell to the east read 35.0% (147 of 420) on 7 November and 37.0% (135 of 365) on 8 November, its highest since 3 November, Debrecen's cell 21.6% (76 of 352) and 15.7% (51 of 324), Kraków's 19.9% (63 of 317) and 16.2% (53 of 327), Rzeszów's thinner cell 69.3% (95 of 137) and 60.3% (88 of 146), and the Bratislava FIR 0.68% and 1.03% FIR-level. The easing call stands. Monday 9 November read 16.7% (51 of 306), inside the band, on the first ordinary sample of 250 aircraft or more since 31 October and the largest since 24 October, ending a run of seven observed days under the floor. The seven-day figure to 9 November is 16.7% (231 of 1,383, six observed days), down from 17.5% as the 21.7% of 2 November left the window, under the cell's 18.6% September level. Next door, the cell to the east read 34.5% (138 of 400), Debrecen's cell 17.3% (74 of 428), Kraków's 15.0% (60 of 399), Rzeszów's thinner cell 52.9% (64 of 121), and the Bratislava FIR 0.68% FIR-level. An in-band reading on an ordinary sample is consistent with the easing we called; the call stands. Tuesday 10 November read 10.6% (21 of 199), inside the band, on what was then the second-thinnest sample in the cell's record. The seven-day figure to 10 November is 12.7% (172 of 1,358, six observed days), the lowest since 11 September, as the 35.7% of 3 November left the window. Next door, the cell to the east read 38.3% (132 of 345), its highest since 3 November, Debrecen's cell 10.9% (34 of 311), Kraków's 11.5% (30 of 262), Rzeszów's thinner cell 70.4% (81 of 115), and the Bratislava FIR 1.11% FIR-level. The easing call stands. Wednesday 11 November read 15.8% (25 of 158), inside the band, on the thinnest sample in the cell's record, and Thursday 12 November 12.9% (34 of 264), inside it again, on an ordinary sample of 250 aircraft or more. The seven-day figure to 12 November is 13.2% (181 of 1,374, six observed days), after 12.7% (167 of 1,318) to 11 November. Next door, the cell to the east read 36.7% (127 of 346) and 36.2% (135 of 373), Debrecen's cell 15.5% (43 of 277) and 15.3% (59 of 385), Kraków's 19.7% (58 of 295) and 11.5% (37 of 321), Rzeszów's thinner cell 58.1% (61 of 105) and 57.3% (59 of 103), and the Bratislava FIR 1.28% and 1.37% FIR-level. The easing held. We said we would call it widening toward Budapest if the capital's cell (47–48°N, 19–20°E) moves clearly above its 10.7% September level for several days: it has read 11.2–15.3% on every day of 12–19 October, above that mean by a few points, 20.2% (169 of 836) on 20 October, its highest since 22.5% on 13 September, 15.1% (121 of 803) on 21 October, 11.1% (98 of 883) on 22 October, 13.9% (126 of 907) on 23 October, 8.8% (77 of 872) on 24 October, below its September level, 17.1% (152 of 890) on 25 October, 9.2% (80 of 870) on 26 October, 7.7% (60 of 784) on 27 October, 5.6% (45 of 800) on 28 October, 5.4% (45 of 830) on 29 October, 5.0% (42 of 840) on 30 October, 7.7% (67 of 869) on 31 October, 12.0% (105 of 876) on 1 November, 10.7% (86 of 805) on 2 November, 11.5% (82 of 713) on 3 November, 11.0% (81 of 735) on 4 November, 9.7% (72 of 740) on 5 November, 11.4% (84 of 740) on 7 November, 10.1% (77 of 761) on 8 November, 8.3% (64 of 768) on 9 November, 6.9% (43 of 625) on 10 November, 8.1% (54 of 663) on 11 November and 6.3% (46 of 734) on 12 November — one day near 20% followed by readings within a few points of its September level, or below it, is not several, so we never made that call; the seven-day figure to 12 November is 8.6% (368 of 4,291), under that September mean, with 6 November missing. This brief is now closed. Both FIRs set new 90-day highs on 20 October — the Budapest FIR 1.05%, the Bratislava FIR 3.43% — and on 21 October the Budapest FIR went higher still, to 1.22%, while the Bratislava FIR eased to 3.29%; on 22 October both eased, to 0.74% and 2.46%, on 23 October both rose again, to 0.97% and 3.29%, still under their highs, on 24 October both eased, to 0.45% and 1.87%, and on 26 October–12 November the Budapest FIR read 0.57%, 0.19%, 0.33%, 0.21%, 0.13%, 0.31%, 0.69%, 0.49%, 0.51%, 0.21%, 0.26%, 0.28%, 0.53%, 0.27%, 0.26%, 0.28%, 0.36% and 0.31% and the Bratislava FIR 1.32%, 0.40%, 1.14%, 0.75%, 0.38%, 1.47%, 2.54%, 1.47%, 2.04%, 0.47%, 0.27%, 1.40%, 0.68%, 1.03%, 0.68%, 1.11%, 1.28% and 1.37% (25 October is missing from the FIR feed). The highs reinforce the FIR-level trend, though FIR-wide measures are diluted by the whole region's traffic. Live airport status: BUD brief · regional picture: GPS interference regional map.
What the data showed — close-out, 14 November. We are closing this brief because the readings it was opened for have settled back into the cell's earlier range and stayed there. Across 12–25 October the 48–49°N, 20–21°E cell aggregated 38.8% (1,766 of 4,555 aircraft), with 13 of 14 observed days above 25%; across 26 October–12 November it aggregated 15.2% (600 of 3,957), with 15 of 17 observed days at or below the 10–25% band of August–September — under the cell's 18.6% September level, though above its 11.6% late-August level. The two days above the band, 30.6% on 1 November and 35.7% on 3 November, both came on samples under 250 aircraft. The rolling seven-day figure peaked at 43.5% to 21 October and read 13.2% to 12 November (six observed days). The 63.5% of 16 October remains the cell's highest reading in 93 observed days since 10 August. FIR-level, the Budapest FIR averaged 0.37% and the Bratislava FIR 1.19% across 1–12 November, against October means of 0.54% and 1.61% and 90-day highs of 1.22% and 3.43%. Budapest's own cell aggregated 8.6% (1,133 of 13,153) across 26 October–12 November, under its 10.7% September level; the widening condition we held open was never met. The wider area has not gone quiet: the cell to the east, at 21–22°E, read 34.5–38.3% on every observed day of 7–12 November and Rzeszów's thinner cell 52.9–70.4%, in line with the long-standing gradient toward the Ukrainian border. Budapest Liszt Ferenc averaged 390 observed movements a day across 26 October–9 November on settled figures (27 October with its collection hole), against ~431 for 16 September–11 October; those weeks fall in the airlines' winter schedule season, and we do not attribute the difference to the interference. 10–13 November are unreadable in our traffic feed after a network-wide collection failure and are not plotted. If this cell climbs back above the band for several days on ordinary samples, we will open a new brief rather than reopen this one.
Passenger questions, answered from the data
As of 14 November 2026, when we closed this brief, the airspace cell over north-east Hungary and south-east Slovakia — around Miskolc, north-east of Budapest — read 63.5% of tracked aircraft flagging degraded navigation on Friday 16 October, its highest since monitoring began on 10 August; it eased to 28.7% on 17 October, then rebounded to 30.4% on 18 October, 40.1% on 19 October, 57.7% on 20 October, 40.9% on 21 October, 29.9% on 22 October, 44.0% on 23 October, 18.3% on 24 October, 39.6% on 25 October, 17.7% on 26 October, 10.0% on 27 October, 4.3% on 28 October, the cell's lowest on record, on what was then its thinnest sample, 9.4% on 29 October, 7.9% on 30 October, 16.2% on 31 October, 30.6% on 1 November, 21.7% on 2 November, 35.7% on 3 November, 15.2% on 4 November, 9.6% on 5 November, 9.7% on 7 November, 12.9% on 8 November, 16.7% on 9 November, 10.6% on 10 November, 15.8% on 11 November and 12.9% on 12 November — 1 and 3 November above the cell's August–September range, both on thin samples, 4, 8, 9, 10, 11 and 12 November inside it and 5 and 7 November below it (6 November a gap in our per-cell feed) — with the seven-day figure at 13.2% to 12 November, under the cell's September level but inside its August–September range, so the easing we called held. Budapest's own cell read 15.3% on 16 October, 20.2% on 20 October, 5.0% on 30 October, 7.7% on 31 October, 12.0% on 1 November, 10.7% on 2 November, 11.5% on 3 November, 11.0% on 4 November, 9.7% on 5 November, 11.4% on 7 November, 10.1% on 8 November, 8.3% on 9 November, 6.9% on 10 November, 8.1% on 11 November and 6.3% on 12 November. Aircraft in the area continue to operate on back-up navigation. Budapest Liszt Ferenc (BUD) logged 446 observed movements on Monday 19 October, in line with its recent Mondays, 421 on Sunday 25 October, 5% under its Sunday reference, 442 on Monday 26 October, in line with its recent Mondays, 351 on Tuesday 27 October, on a day with a one-hour collection hole, 382 on Wednesday 28 October, the lowest settled Wednesday in the window, 412 on Thursday 29 October, 8% under its Thursday reference at the time, 450 on Friday 30 October, in line with its recent Fridays, 362 on Saturday 31 October, the lowest Saturday in the window, 417 on Sunday 1 November, the lowest Sunday in the window, 428 on Monday 2 November, 3% under its Monday reference, 321 on Tuesday 3 November, 16% under its Tuesday reference and the lowest day in the window, 325 on Wednesday 4 November, 24% under its Wednesday reference at the time and the lowest Wednesday in the window, 388 on Thursday 5 November, 10% under its Thursday reference at the time and the lowest Thursday in the window, 447 on Friday 6 November, 1% under its Friday reference, 336 on Saturday 7 November, 10% under its Saturday reference at the time and the lowest Saturday in the window, 381 on Sunday 8 November, 13% under its Sunday reference at the time and the lowest Sunday in the window, and 412 on Monday 9 November, 7% under its Monday reference at the time (both settled; 10–13 November unreadable in our traffic feed); we do not attribute traffic changes to the interference. See the live BUD brief and check your airline's status on the day of travel.
GNSS interference does not usually cancel flights: airliners fall back on inertial navigation and ground-based aids, and Budapest's runways have instrument landing systems that do not rely on satellites. Across 12 October–9 November, a period that includes the run of high readings north-east of the city, BUD logged 321–454 observed movements a day (the low on 3 November) against a ~431 average for 16 September–11 October. Cancellations are an airline decision — check with your carrier.
The level is new for this cell; the zone is not. The 48–49°N, 20–21°E cell had never read above 44.8% in 66 earlier observed days and averaged 11.6% in late August and 18.6% in September before climbing to 63.5% on 16 October. But it sits at the western end of a gradient that has been strongest along the Ukrainian border throughout our record — 96.0% at 22–23°E on the same day. What moved in mid-October is how far west the high readings reach. Regional view: GPS interference regional map.
From the Navigation Integrity Category that aircraft broadcast over ADS-B, collected by crowdsourced receiver networks and aggregated by FlySafe into daily 1°×1° cells. Counts are a floor, not a total. FIR-level figures for the Budapest (LHCC) and Bratislava (LZBB) FIRs come from the same public data and are labelled as FIR-level. Method: methodology.
For media — the full kit
Everything on this page — charts, CSV, quotes — is published under CC BY 4.0: free to reuse with attribution to FlySafe.zone. Charts come in dark (social/web) and light (print/light layouts) versions; attribution and license are embedded in every file.
“Over north-east Hungary and south-east Slovakia, around Miskolc, 63.5% of tracked aircraft broadcast degraded navigation integrity on 16 October 2026 — the highest reading for that airspace since per-cell monitoring began on 10 August. Readings stayed elevated on most days through 25 October, then fell back: 28.7% on 17 October, 30.4% on 18 October, 40.1% on 19 October, 57.7% on 20 October, 40.9% on 21 October, 29.9% on 22 October, 44.0% on 23 October, 18.3% on 24 October, 39.6% on 25 October, 17.7% on 26 October, 10.0% on 27 October, 4.3% on 28 October — the cell's lowest on record, on what was then its thinnest sample — 9.4% on 29 October, 7.9% on 30 October, 16.2% on 31 October, 30.6% on 1 November, 21.7% on 2 November, 35.7% on 3 November, 15.2% on 4 November, 9.6% on 5 November, 9.7% on 7 November, 12.9% on 8 November, 16.7% on 9 November, the first sample of 250 aircraft or more since 31 October, 10.6% on 10 November, 15.8% on 11 November and 12.9% on 12 November, with the rolling seven-day figure at 13.2% to 12 November, inside the cell's August–September range, after holding above 30% on every day of 14–26 October. The area is the western edge of a gradient that read 87–96% near the Ukrainian border on 16 October, and 21 of 46 cells across the region set their highest readings since August that day. Budapest's own airspace read 15.3%, and observed traffic at Budapest Liszt Ferenc stayed within about 10% of its day-of-week reference levels through 2 November, with 3–5 November 10–24% under, 6 November 1% under, 7 November 10% under, 8 November 13% under and 9 November 7% under, all on settled counts, according to flight-monitoring service FlySafe.zone, which closed its brief on the episode on 14 November.”
Boilerplate — about the source (for your article footer)
FlySafe.zone monitors airspace risk and observed airport activity worldwide: 334 flight-information regions scored daily, GPS-interference signals, volcanic-ash exposure and daily observed movements at 493 airports from the crowdsourced ADS-B receiver network. Methodology: flysafe.zone/methodology.
Need a different cut of the data, a comment, or numbers for another airport? Leave an email — we answer fast during active events.