GPS Interference Around Bucharest, October 2026: 65.4% of Aircraft Flag Degraded Navigation Over the Buzău Carpathians on 5 October, and Bucharest's Own Airspace Cell Reads 59.9%, Its Second-Highest Day Since Monitoring Began
- Bucharest (OTP) is operating — observed movements averaged about 364/day across 5–30 September and read 344, 360, 294 and 329 on 1–4 October. The 3–4 October weekend was the softest in the window, partly because our receiver network logged fewer flights overall. Check your airline on the day.
- North-north-east of the city, over the Carpathian foothills around Buzău, 65.4% of tracked aircraft flagged degraded navigation on 5 October — the highest since 26 September. The share has climbed from 40% in August to 55% in September; a one-day dip to 18.5% on 28 September did not last.
- On 5 October the elevated readings reached Bucharest's own airspace cell: 59.9%, its second-highest day since monitoring began. The zone is a gradient, not a wall: 7.9% at 21–22°E over western Romania, 23.9% at 23–24°E, 48.1% at 24–25°E near Sibiu, 59.1% at 25–26°E over Brașov, 65.4% at 26–27°E — and 5.8–25.0% across the Danube over north-central Bulgaria (24–27°E).
- GPS interference is a navigation-integrity issue, not a closure event — inertial systems and ground-based aids (ILS, VOR/DME) back satellite navigation up; the practical cost is precision and crew workload, occasionally a diversion in poor weather.
Advisory timeline — how active is this episode
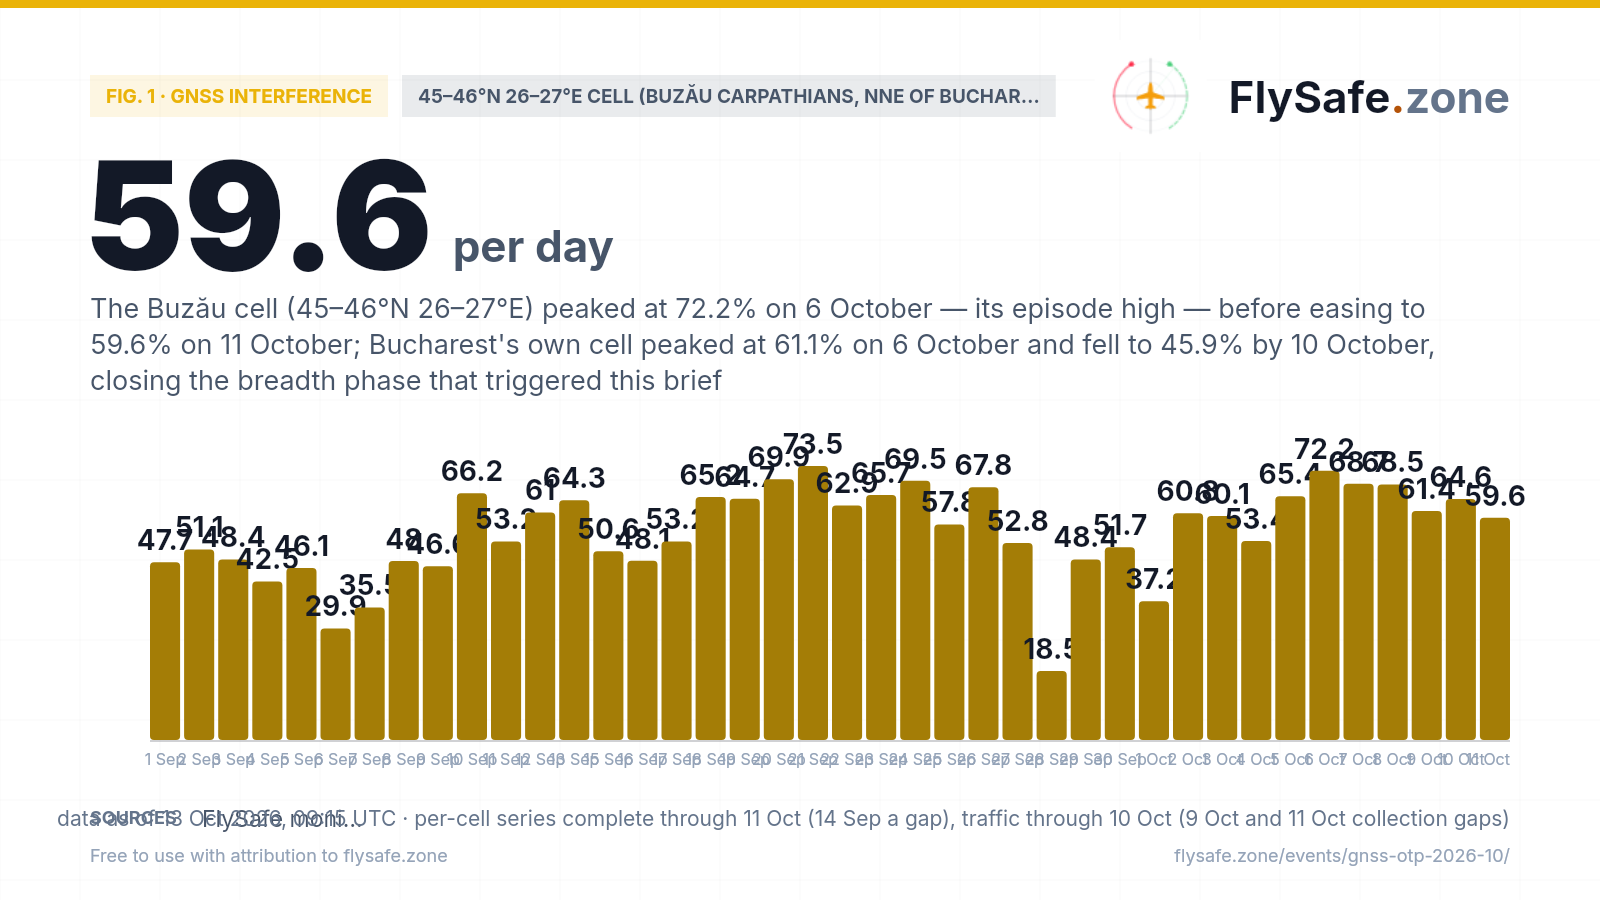
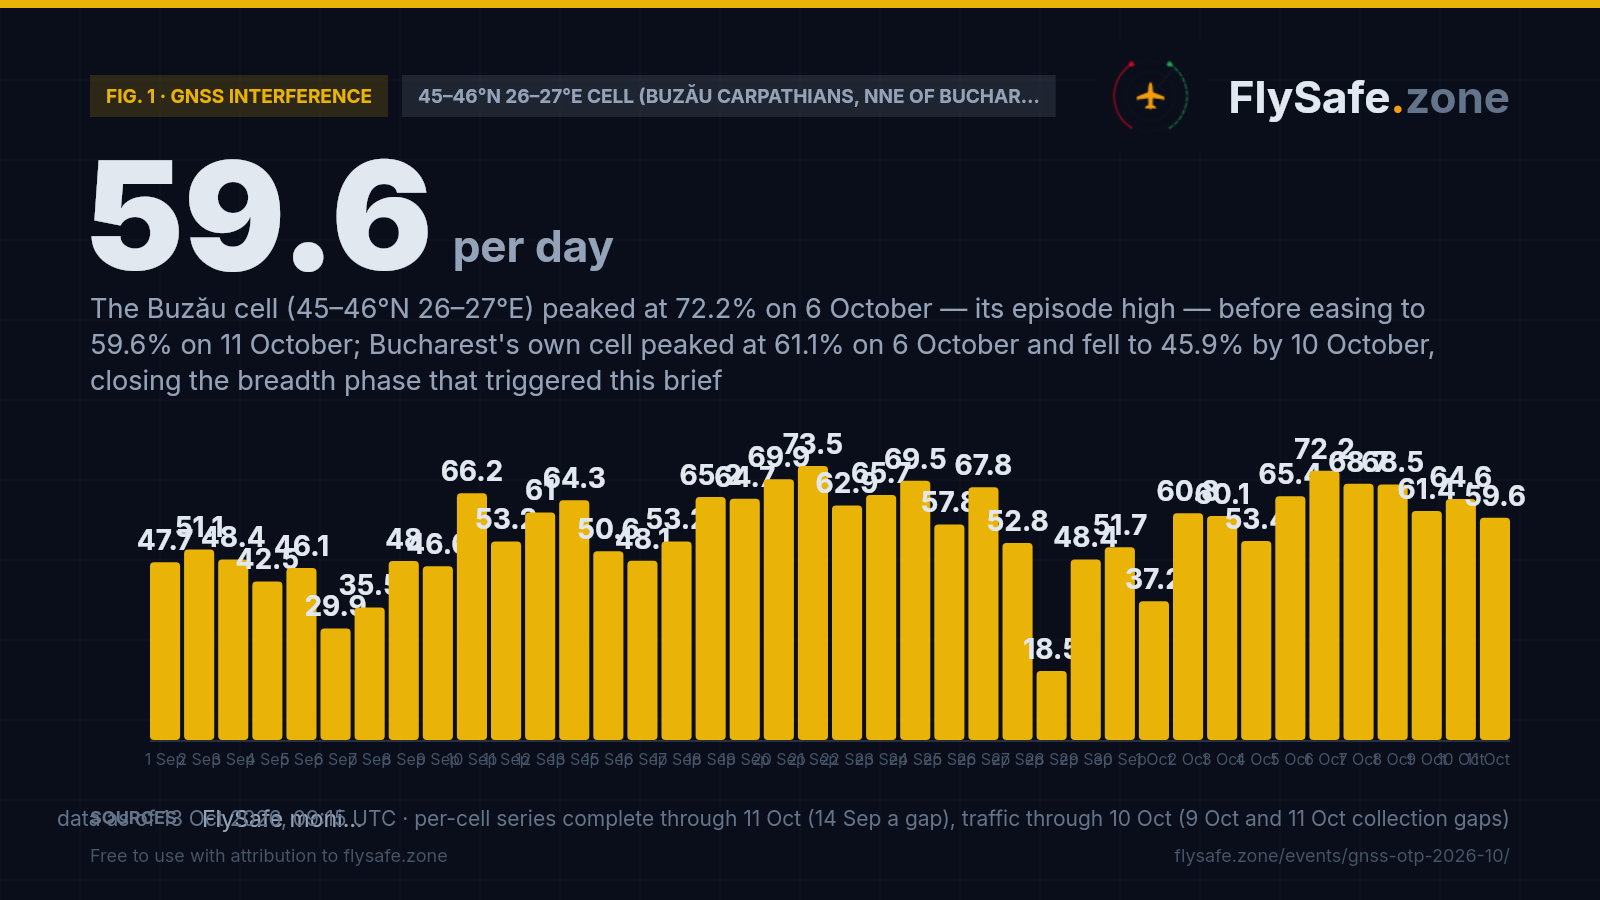
Our detection layer reads the navigation-integrity field every ADS-B aircraft broadcasts — the Navigation Integrity Category, a self-reported measure of how far the aircraft trusts its own position. When satellite navigation is jammed or spoofed, receivers lower that figure, and the share of aircraft broadcasting a low NIC rises. The cell behind this brief is the 1°×1° box spanning 45–46°N, 26–27°E — the Buzău side of the Curvature Carpathians, from the plain north of Ploiești up into the mountains around Buzău and southern Vrancea, its southern edge about 50 km north of Bucharest Henri Coandă. It is the eastern neighbour of the Prahova Valley cell covered in our September brief, and carries a thinner sample — about 190 tracked aircraft a day against about 600 there. Monday 5 October read 65.4% (134 of 205 aircraft), the cell's highest day since 26 September (67.8%) and eighth of 56 observed days. October so far reads 37.2% → 60.8% → 60.1% → 53.4% → 65.4%, or 55.9% aggregated (533 of 954). We say plainly why our threshold fired, because it overstates the novelty: the automated test looks for a cell that was quiet seven days earlier, and seven days earlier was Monday 28 September — 18.5% (22 of 119), the series' only day below 20% since 13 August and its thinnest sample. Every other day since 30 August has read 29.9% or more. The longer record is a climb: 30.6% in the first week (10–16 August), 40.1% across 10–31 August (1,651 of 4,115), 55.2% across September (3,108 of 5,628, 29 observed days). The complete week of 21–27 September is the highest in the series at 64.9% (1,020 of 1,571), with the single highest day on 21 September at 73.5% (166 of 226). The rolling seven-day figure peaked at 67.3% on 24 September, eased to 48.8% on 3 October and is back at 54.2% (730 of 1,347) on 5 October. 14 September is a gap in our per-cell feed and is left out of the chart, not plotted as zero.
Fig. 1 — daily share of tracked aircraft broadcasting a low Navigation Integrity Category (NIC) in the 45–46°N 26–27°E cell (Buzău side of the Curvature Carpathians, north-north-east of Bucharest), % — crowdsourced ADS-B network; 14 Sep a collection gap · Data as of 13 Oct 2026, 09:15 UTC · per-cell series complete through 11 Oct (14 Sep a gap), traffic through 10 Oct (9 Oct and 11 Oct collection gaps) · Source: FlySafe monitoring — crowdsourced ADS-B navigation-integrity data (public).
Airports in the exposure zone
| Airport | Size | Distance from cell centre · exposure (5 Oct) | FIR |
|---|---|---|---|
| Bucharest Henri Coandă (OTP) | large | 108 km · own cell 44–45°N 26–27°E ≈59.9% flagged (445 of 743; 46.1% over 7 days) · 329 movements on 4 Oct | LRBB |
| Bucharest Băneasa (BBU) | medium | 115 km · shares Bucharest's cell — ≈59.9% flagged | LRBB |
| Brașov-Ghimbav (GHV) | medium | 79 km · western neighbour cell 45–46°N 25–26°E — ≈59.1% flagged (356 of 602; 47.9% over 7 days) | LRBB |
| Bacău George Enescu (BCM) | medium | 118 km · northern neighbour cell 46–47°N 26–27°E — 5 of 13 aircraft flagged (thin sample; 36.4% over 7 days) | LRBB |
| Sibiu (SBZ) | medium | 190 km · own cell 45–46°N 24–25°E ≈48.1% flagged (337 of 701; 37.2% over 7 days) | LRBB |
| Constanța Mihail Kogălniceanu (CND) | medium | 201 km · own cell 44–45°N 28–29°E — 22 of 48 aircraft flagged (thin sample; 42.2% over 7 days) | LRBB |
Distance alone does not determine impact — wind direction and the flight levels the ash reaches decide which airports and routes are affected on a given day. FIR = Flight Information Region.
What our monitoring shows: Bucharest traffic through the October readings
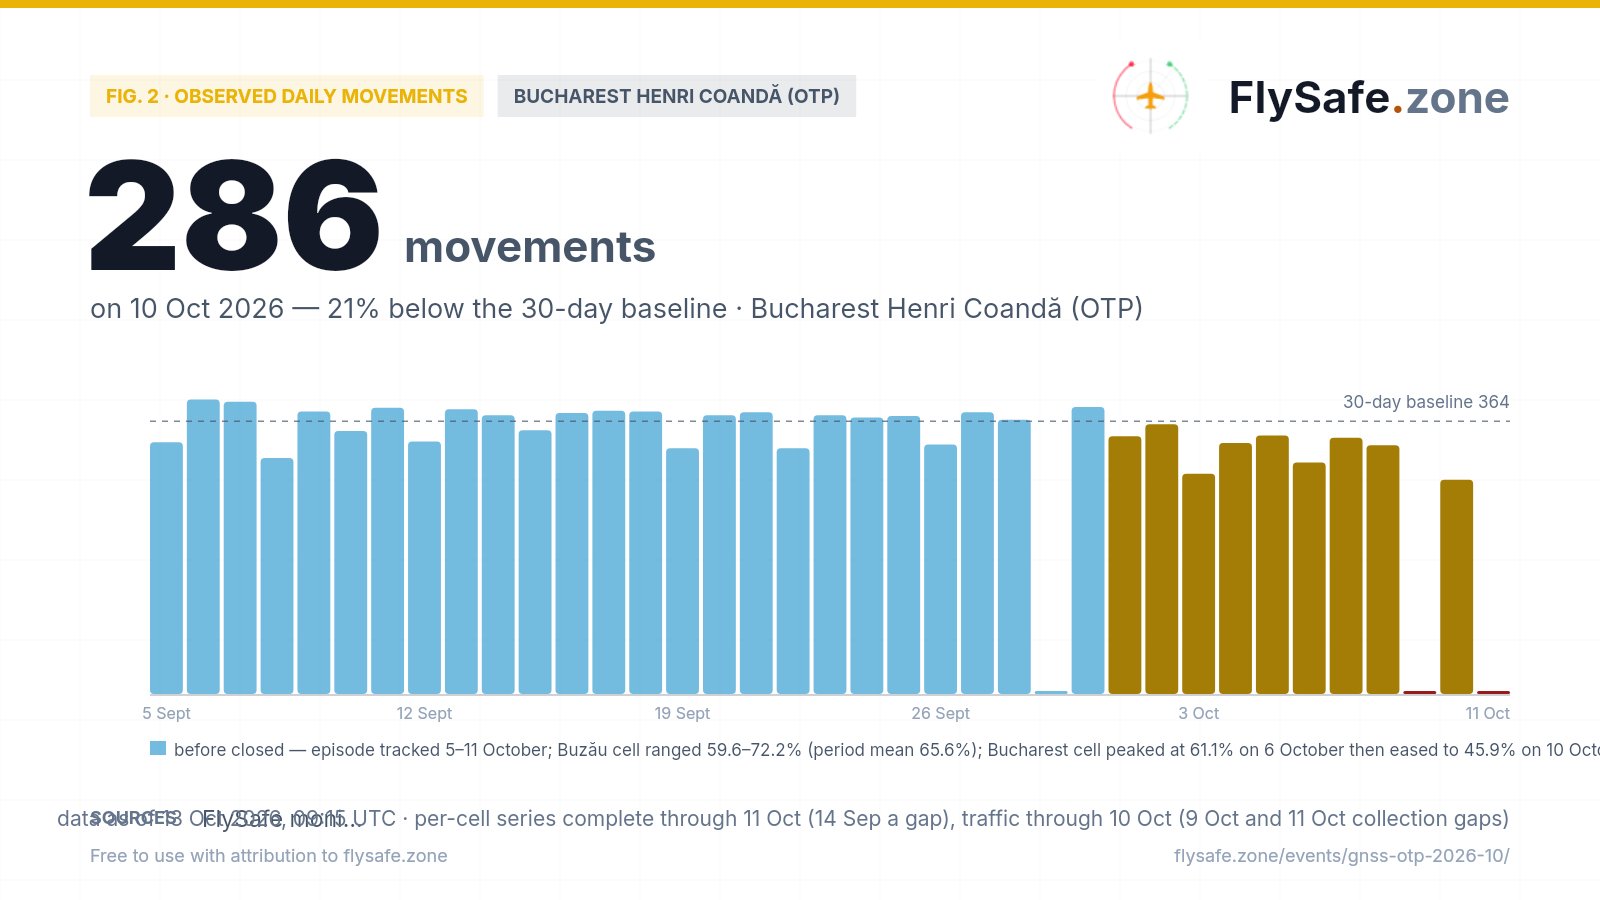
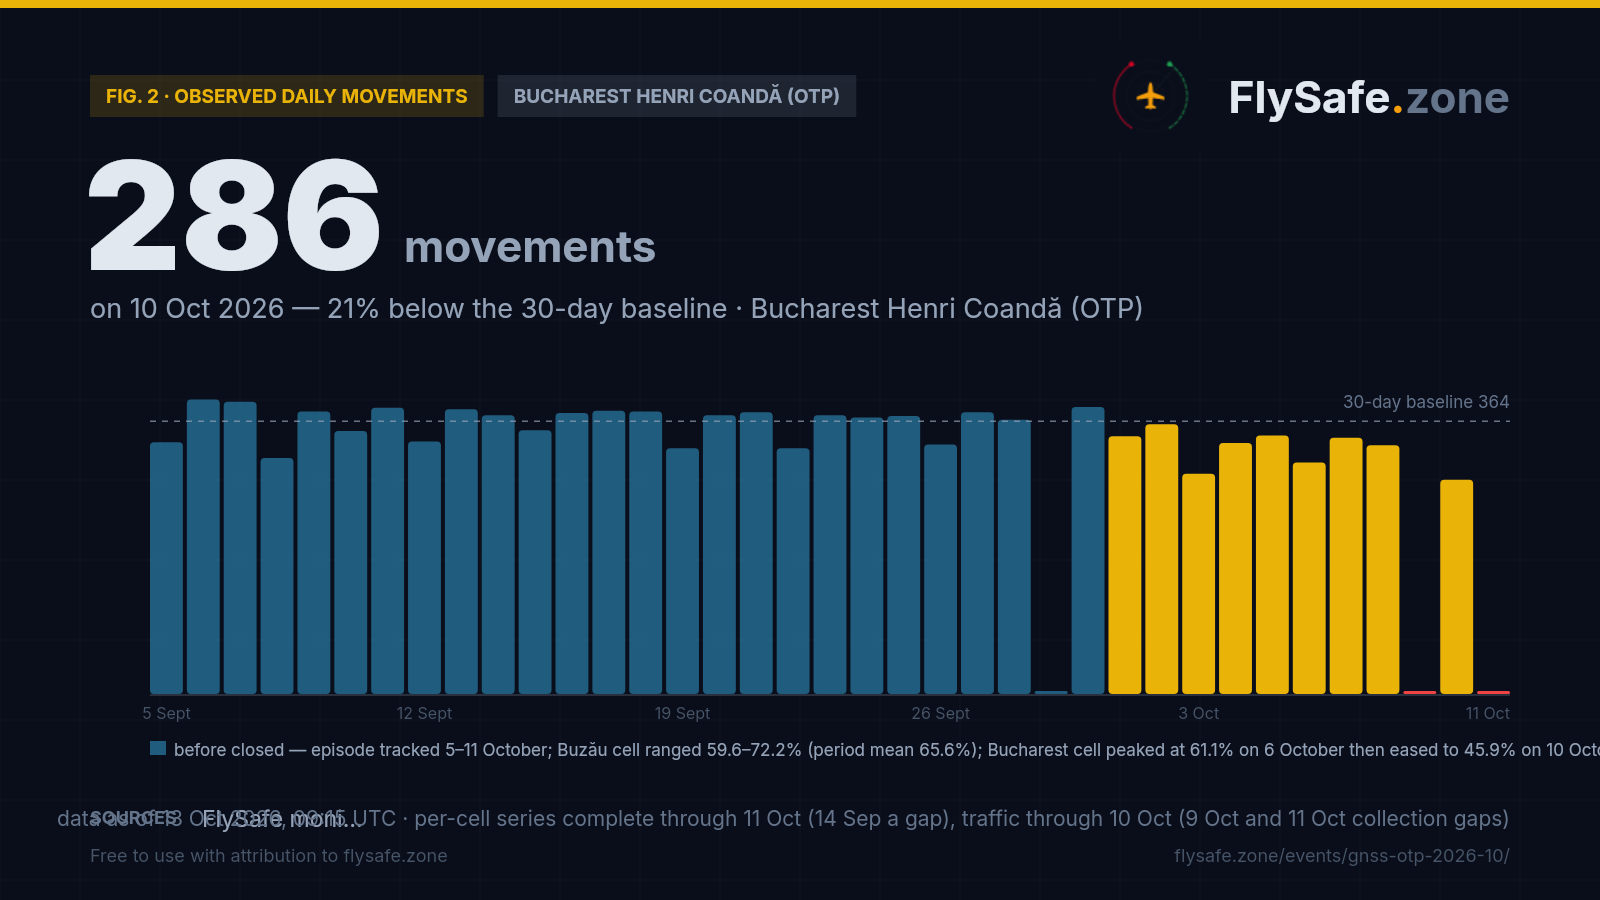
FlySafe tracks observed departures and arrivals at 493 airports from crowdsourced ADS-B receiver data. Observed counts are a floor, not a total — receiver coverage varies — but an airport measured against its own baseline is a reliable shape. Bucharest Henri Coandă's last 30 days:
Fig. 2 — Observed daily movements at OTP, 5 Sept – 11 Oct (latest complete UTC day). Data as of 13 Oct 2026, 09:15 UTC · per-cell series complete through 11 Oct (14 Sep a gap), traffic through 10 Oct (9 Oct and 11 Oct collection gaps) · Source: FlySafe monitoring (ADS-B receiver network).
- Across 5–30 September (25 plotted days) Bucharest Henri Coandă averaged ~364 observed movements a day — the reference line on the chart. Observed counts are a floor, not a total.
- October readings with complete collection: 344 / 360 / 294 / 335 / 345 / 309 / 342 / 332 / 286 on 1–8 and 10 October. 9 October and 11 October are left as gaps — our feed logged only 18 and 19 movements on those days respectively, indicating collection interruptions, not actual traffic.
- Tuesday 29 September is a gap — a midday hole in our OTP collection (2 and 0 movements in the 13:00–14:00 UTC hours against 14–22 on adjacent days).
- No day across 1–10 October departed sharply from the September average, and we make no attribution to the interference. GNSS degradation is a navigation-integrity issue that crews work around on back-up systems and does not normally remove flights from a schedule.
What it means for flights
The news is the reach, not the novelty. Romanian airspace has carried elevated GNSS interference since the war in Ukraine brought electronic-warfare reach across the Black Sea basin (background: the Plovdiv jamming incident of 2025 and how GPS jamming works). The Buzău cell is not a fresh hotspot — it has never read below 15.7% since 10 August and has averaged above 50% since September began. What 5 October adds is breadth: seven contiguous inland cells, from Sibiu and Târgu Mureș to Buzău and Bucharest, read 46.9% or more on the same day — 66.0% over Miercurea Ciuc (a thinner sample of 103 aircraft), 65.4% over Buzău, 59.9% over Bucharest, 59.1% over Brașov, 53.5% over Târgu Mureș, 48.1% over Sibiu, 46.9% west of the capital — and two of them, Bucharest's and the cell west of it, are at or near the top of their own series. Our threshold labelled this a new zone because the day it compared against, 28 September, was a band-wide collapse — across central Romania (44–47°N, 22–27°E) the flagged share fell to 9.9% that day, against 22–33% on the days either side. We report the trigger and the context it lacked.
What it means for flights. A low NIC tells us an aircraft's satellite-derived position is less trustworthy than normal, not that the aircraft is off course. Airliners blend GNSS with inertial reference systems and ground-based navaids, and approaches into Bucharest have instrument landing systems that do not depend on satellites. Where interference bites is precision and workload: RNP approaches that need GNSS may be unavailable, crews cross-check more, and terrain or traffic warnings that rely on GNSS position can misbehave. We make no call on whether to fly — that belongs to the operator and the regulator. We note that our NOTAM feed does not currently carry the Bucharest FIR, so we cannot report what Romanian authorities have or have not published on GNSS reliability; check the current NOTAMs for LRBB through official channels.
How to read the numbers on this page. Every percentage here is the share of tracked aircraft in a 1°×1° cell that broadcast a low NIC at least once that day — a floor, not a total, because our receivers do not see every aircraft. Cells with a few dozen aircraft a day (Bacău, Constanța) swing widely and are marked as thin samples. The FIR-level figure for LRBB (3.2% on 5 October, 3.0% over seven days) is a different, region-wide measure across 21,000–26,000 aircraft a day and is not comparable to a single cell's share; it has stayed between 2.2% and 3.6% on every day since 26 September. Two collection gaps are marked rather than filled: 14 September in the per-cell feed, and 29 September in OTP's traffic count.
What would change our reading. We will call this episode easing if the Buzău cell's seven-day figure falls back toward its August level (about 40%) on ordinary samples of 150 aircraft or more — one low day, as 28 September showed, is not enough. We will call it widening if Bucharest's own cell holds above 55% for several days, or if OTP's weekday traffic sits at the bottom of its range alongside high readings. Until then the page stays active and is updated as new days land. Live airport status: OTP brief.
What the data showed: episode close-out. The episode recorded by this brief ran from 5 October to 11 October 2026, the final day in our per-cell series at close-out. The Buzău cell (45–46°N, 26–27°E) reached its period peak of 72.2% (135 of 187 aircraft) on Tuesday 6 October, one day after the initial alert; across 5–11 October it averaged 65.6% (881 of 1,342 aircraft). The seven-day rolling figure did not fall toward the August baseline of about 40%, consistent with the cell's chronic character — interference here has never read below 15.7% since per-cell monitoring began on 10 August. What resolved was the breadth event that triggered this brief: Bucharest's own airspace cell (44–45°N, 26–27°E) peaked at 61.1% (460 of 753 aircraft) on 6 October and stepped down — 54.5%, 51.9%, 50.3%, 45.9% across 7–10 October — falling below the 55% threshold identified in our live reading as the widening signal. It did not hold above 55% for several days, and no widening call was made. The Bucharest FIR (LRBB) held in the range of 3.2–4.6% across 5–11 October, against a 90-day baseline of 3.4% — of the same order throughout. Bucharest Henri Coandă (OTP) recorded 345, 309, 342, 332 and 286 observed movements on 5, 6, 7, 8 and 10 October respectively (9 October and 11 October have collection gaps). No day departed sharply from the September average of 364, and no attribution to the interference is made. Per-cell data for this region is available continuously in the Airspace Indices tool.
Passenger questions, answered from the data
As of 6 October 2026, the airspace cell over the Buzău side of the Carpathians, north-north-east of Bucharest, read 65.4% of tracked aircraft flagging degraded navigation on Monday 5 October, and Bucharest's own cell read 59.9% — its second-highest day since monitoring began on 10 August. Aircraft in the area continue to operate on back-up navigation. Bucharest Henri Coandă (OTP) logged 294 and 329 observed movements on 3–4 October, its softest weekend in 30 days, partly a collection effect; we do not attribute it to the interference. See the live OTP brief and check your airline's status on the day of travel.
GNSS interference does not usually cancel flights: airliners fall back on inertial navigation and ground-based aids, and Bucharest's runways have instrument landing systems that do not rely on satellites. Across 5–30 September, while the interference readings rose, OTP averaged about 364 observed movements a day. Cancellations are an airline decision — check with your carrier.
No. The cell north-north-east of Bucharest has read elevated since our per-cell monitoring began on 10 August — 40.1% across 10–31 August and 55.2% across September. Our automated threshold flagged it as new because the comparison day, 28 September, collapsed to 18.5% on the thinnest sample in the series. What is new on 5 October is how far the elevated readings reached, including Bucharest's own cell at 59.9%. The neighbouring cell to the west is covered in our September brief.
From the Navigation Integrity Category that aircraft broadcast over ADS-B, collected by crowdsourced receiver networks and aggregated by FlySafe into daily 1°×1° cells. Counts are a floor, not a total. FIR-level figures for the Bucharest FIR (LRBB) come from the same public data and are labelled as FIR-level. Method: methodology.
For media — the full kit
Everything on this page — charts, CSV, quotes — is published under CC BY 4.0: free to reuse with attribution to FlySafe.zone. Charts come in dark (social/web) and light (print/light layouts) versions; attribution and license are embedded in every file.
“Over the Carpathian foothills around Buzău, north-north-east of Bucharest, 65.4% of tracked aircraft broadcast degraded navigation integrity on 5 October 2026 — the highest reading there since 26 September — and the cell over Bucharest itself read 59.9%, its second-highest day since per-cell monitoring began on 10 August. The zone is not new: the share in the Buzău cell rose from 40.1% across late August to 55.2% across September, and a one-day collapse to 18.5% on 28 September did not repeat. Bucharest Henri Coandă's observed traffic had its softest weekend in 30 days on 3–4 October, partly a collection effect, according to flight-monitoring service FlySafe.zone.”
Boilerplate — about the source (for your article footer)
FlySafe.zone monitors airspace risk and observed airport activity worldwide: 334 flight-information regions scored daily, GPS-interference signals, volcanic-ash exposure and daily observed movements at 493 airports from the crowdsourced ADS-B receiver network. Methodology: flysafe.zone/methodology.
Need a different cut of the data, a comment, or numbers for another airport? Leave an email — we answer fast during active events.