Between 1 January and 17 August 2026, FlySafe airspace-risk collectors logged 666 confirmed airspace-disruption events across 73 flight information regions (FIRs), amounting to 5,555 airspace-days — the cumulative count of flying days on which a defined airspace volume carried an active, corroborated operational restriction. Every figure below reflects confirmed events only: each required at least two independent signals and an attributed cause, with undetermined-cause detections excluded. FlySafe analysis shows the disruption load is heavily concentrated in a small number of FIRs, and — separately — that reviewing NOTAMs alone would have missed most of what actually occurred.
Searches for phrases such as "canada airspace closed," "is qatar airspace closed," or "is uae airspace closed" spike whenever an operational event makes headlines. The more durable question for flight planners is not whether one named airspace is closed on a given day, but which FIRs have accumulated the most lost flying days over the year, and how reliably those disruptions were detectable in advance. This bulletin answers the second question with the data as of 17 August 2026.
Which FIRs Lost the Most Flying Days in 2026
The distribution is top-heavy. The six most-disrupted FIRs below account for a large share of the 5,555 total airspace-days recorded across all 73 affected regions. Corroboration columns show the proportion of each FIR's events confirmed by FlySafe's own ADS-B flight-traffic collection versus by public NOTAM.
| Rank | FIR | Events | Airspace-days | Flight-traffic corrob. | NOTAM corrob. |
|---|---|---|---|---|---|
| 1 | Damascus (OSTT) | 68 | 766.0 | 28% | 71% |
| 2 | RPHI | 44 | 506.0 | 0% | 95% |
| 3 | SEFG | 32 | 480.0 | 0% | 100% |
| 4 | SKED | 31 | 465.0 | 100% | 100% |
| 5 | UHMM | 38 | 437.0 | 0% | 97% |
| 6 | SPIM | 29 | 431.0 | 100% | 100% |
Source: FlySafe airspace-risk collectors, confirmed events only, as of 17 August 2026.
Damascus FIR (OSTT) leads by a wide margin at 766.0 airspace-days across 68 events — the single largest disruption burden of any FIR in the dataset. RPHI (506.0 days) and SEFG (480.0 days) follow. The number of events and the number of airspace-days do not track one another cleanly: UHMM logged 38 events for 437.0 days, while SKED reached 465.0 days from just 31 events, indicating longer-running individual restrictions in the latter. Across the full dataset the average confirmed disruption ran approximately 8.3 airspace-days.
This concentration is the practical answer to the recurring "is [X] airspace closed" question. Rather than tracking one jurisdiction — whether that is a Canadian, Qatari, Jordanian or UAE FIR — flight planners benefit more from a ranked, corroborated view of where lost flying days are actually accumulating. For a regional comparison, see FlySafe's breakdown of which FIRs lost the most days in the UAE region in 2026 and the full 2026 ranking of the most-disrupted FIRs.
The Monthly Trend: Disruption Load Rose Through Mid-Year
Confirmed events were not evenly distributed across the year. The monthly count climbed steeply from spring into summer before easing in August:
| Month | Confirmed events |
|---|---|
| January | 5 |
| February | 16 |
| March | 1 |
| April | 21 |
| May | 72 |
| June | 143 |
| July | 350 |
| August (to 17th) | 58 |
Source: FlySafe airspace-risk collectors, as of 17 August 2026.
July stands out at 350 confirmed events — more than half of the year-to-date total in a single month. The March figure of 1 is equally notable in the other direction. The August count of 58 covers only the first 17 days of the month, so it is a partial figure and should not be read as a full-month total. The bulletin reports these counts as metrics; it does not attribute the trend to any single external factor.
The Detection Signal-Gap: NOTAM-Only Review Misses the Majority
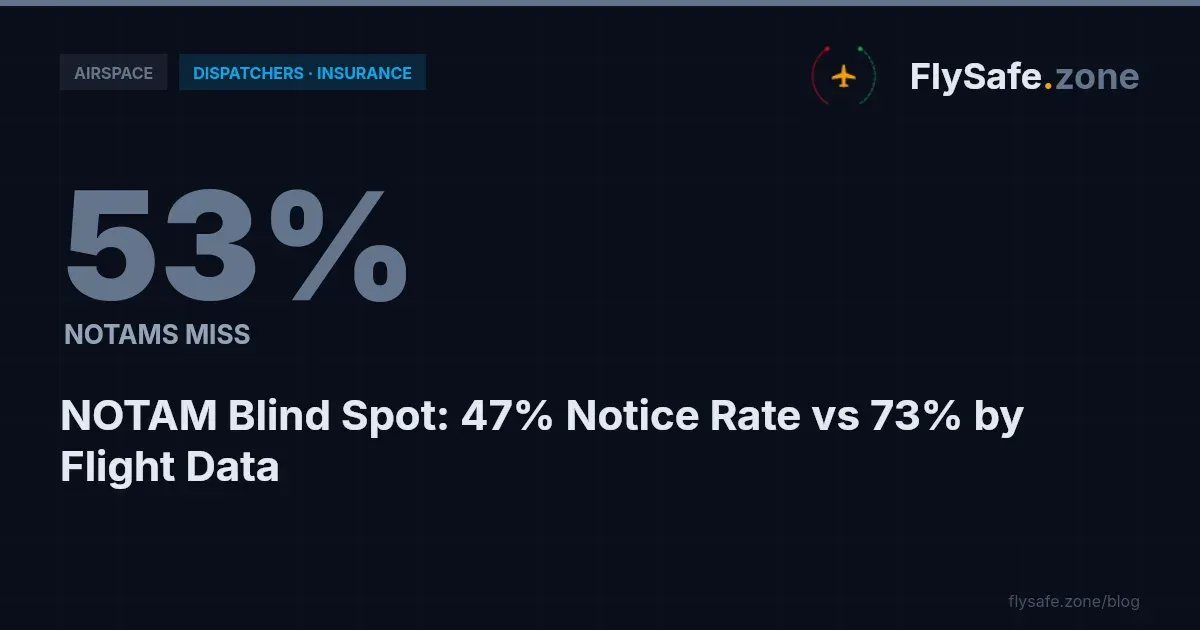
The most operationally consequential finding in the dataset is not a ranking — it is a measurement gap. Restricting the analysis to FIRs with at least three events, flight-traffic corroboration confirmed roughly 75% of confirmed disruptions, while NOTAM corroboration confirmed roughly 45%. A review built on NOTAMs alone would therefore have missed the majority of confirmed disruptions.
The FIR table makes the mechanism visible. Several high-ranking FIRs — RPHI, SEFG, UHMM — show near-total NOTAM corroboration but 0% flight-traffic corroboration, meaning the restriction was published but not independently observed as a change in traffic. Others — SKED and SPIM — show 100% corroboration on both signals. Damascus FIR sits between the two, with 71% NOTAM and 28% flight-traffic corroboration. Because each confirmed event in the FlySafe dataset requires at least two independent signals, no single feed is treated as ground truth; observed traffic and published notices are cross-checked against each other.
The practical implication for dispatch and route planning is that a NOTAM feed is necessary but not sufficient. FlySafe's dedicated analysis of how NOTAMs miss most aviation airspace disruptions in 2026 examines this gap in depth.
Cause Categories: A Neutral Operational Breakdown
Confirmed disruptions are grouped into neutral operational categories by airspace-days:
| Category | Airspace-days | Share | Events |
|---|---|---|---|
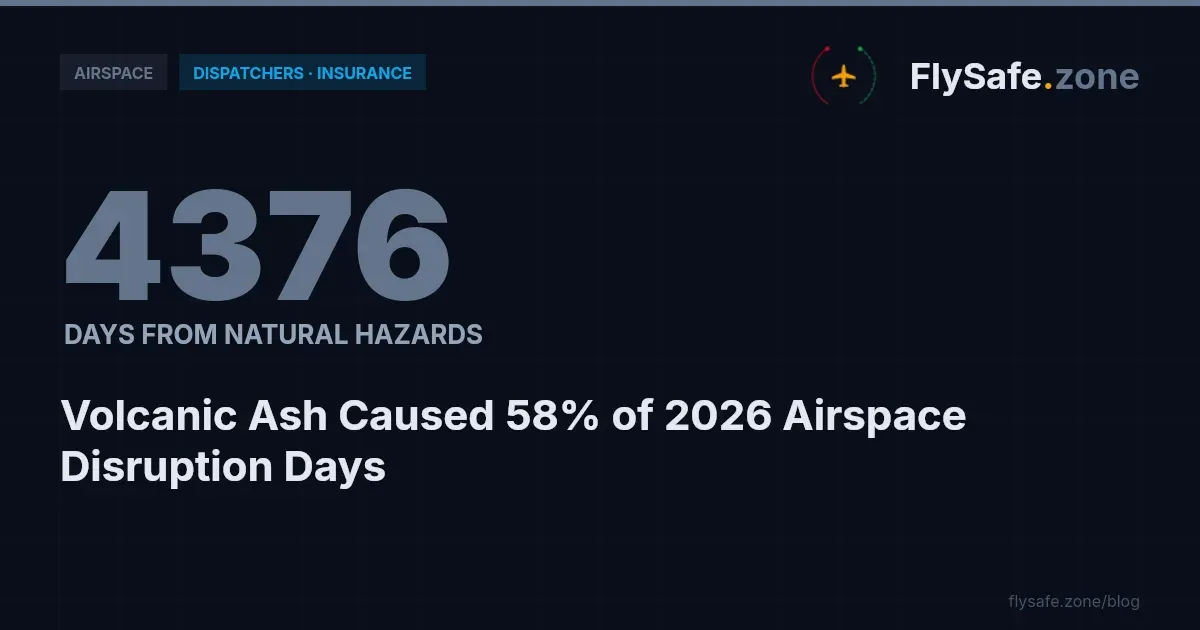
| Volcanic ash | 3,196 | 58% | 306 |
| Conflict-zone restrictions | 1,800 | 32% | 235 |
| Seismic activity | 309 | 6% | 47 |
| Tropical cyclones | 153 | 3% | 32 |
| Other regulatory restrictions | 97 | 2% | 46 |
Source: FlySafe airspace-risk collectors, as of 17 August 2026.
Volcanic ash is the largest single category by airspace-days, at 3,196 days across 306 events. Conflict-zone restrictions account for 1,800 days across 235 events. Seismic activity, tropical cyclones and other regulatory restrictions make up the remainder. These categories describe the operational nature of each restriction only; the bulletin does not attribute any political or geographic cause. Volcanic-ash and seismic advisories in particular are corroborated against the public SIGMET and volcanic-ash advisory feeds that feed the consensus engine.
Recovery Status: All Confirmed Disruptions Have Ended
As of 17 August 2026, all 666 confirmed disruptions in the dataset have ended — 332 of them within the trailing 30 days. This is a status snapshot, not a forecast: an airspace volume that has reopened can be re-restricted, and the recovery count reflects only events confirmed as concluded at the as-of date. The average confirmed disruption ran approximately 8.3 airspace-days from onset to end.
Regulatory Context
Airspace restrictions and the notices that publish them sit within a well-defined international and national framework. The following apply directly to the material above:
- ICAO Annex 11 (Air Traffic Services) and ICAO Doc 4444 (PANS-ATM) govern how FIRs are defined and how air traffic services manage restricted volumes within them.
- ICAO Annex 15 (Aeronautical Information Services) governs the NOTAM and AIP system — the primary published mechanism through which airspace closures and restrictions are promulgated. The signal-gap finding above concerns the completeness of the NOTAM layer specifically, not its regulatory authority.
- ICAO Annex 19 (Safety Management) frames the safety-data and risk-management practices under which operators assess airspace risk.
- EU Regulation 965/2012 (Air Operations) sets the operational rules under which EU/EEA operators plan around restricted airspace, and EASA Conflict Zone Information Bulletins (CZIB) provide advisory-level guidance where a state-level restriction may or may not be in force. A CZIB is advisory only unless the underlying airspace is closed or restricted by a state NOTAM or AIP entry.
- 14 CFR Part 91 (General Operating and Flight Rules, FAA) and the FAA Aeronautical Information Manual govern US-registered operations and the handling of Temporary Flight Restrictions and international overflight.
Operators should treat these frameworks as the authoritative basis for flight planning. FlySafe data is an analytical overlay, not a regulatory instrument.
Methodology and Provenance
- Window: 1 January 2026 – 17 August 2026. Data as of 17 August 2026.
- Confirmation standard: confirmed events only — each required at least two independent signals and an attributed cause. Undetermined-cause detections were excluded.
- Consensus engine: the FlySafe engine requires at least two independent signals per event. FlySafe's own ADS-B flight-traffic collection is the primary corroborating signal.
- Inputs: public NOTAM, EASA and FAA TFR notices, volcanic-ash and seismic advisories, plus FlySafe ADS-B flight-traffic data.
- Honest gaps: the dataset does not include disruption costs, specific NOTAM identifiers, or carrier-level routing changes; those figures are not currently available in this dataset and have not been estimated. No FIR codes, dates, costs or NOTAM references beyond those in the source data have been added.
Key Takeaway
Airspace disruption in 2026 to date is concentrated, not diffuse: 666 confirmed events and 5,555 airspace-days across 73 FIRs, led by Damascus FIR at 766.0 days. The load rose sharply into July before easing in a partial August. And the single most actionable finding is the detection gap — flight-traffic corroboration confirmed roughly 75% of disruptions in FIRs with three or more events, against roughly 45% for NOTAMs. Whether the question is "is qatar airspace closed," "is uae airspace closed," or which Canadian FIR is affected on a given day, a NOTAM-only check is likely to be incomplete.
FlySafe combines public NOTAM, EASA, FAA, volcanic-ash and seismic advisories with independent ADS-B flight-traffic observation, requiring at least two corroborating signals before an event is confirmed — closing the gap that single-source monitoring leaves open. For a related regional analysis, see FlySafe's review of what the 2026 data shows about Caribbean airspace.
Analysis based on publicly available data only. FlySafe is a research and analysis service, not an operational or regulatory authority; it does not issue, amend or supersede NOTAMs, AIP entries, or any state CAA instruction. Operators must consult official NOTAMs, AIP entries, and their national authority for flight-planning decisions.
- Reviewing NOTAMs alone misses the majority of confirmed airspace disruptions — FlySafe's multi-signal corroboration approach captured events that NOTAM-only monitoring would not have flagged, which is the practical gap for flight planners relying on a single data source.
- Disruption load is heavily concentrated: six FIRs out of 73 account for a disproportionate share of all 5,555 airspace-days, with Damascus (OSTT) alone carrying 766 days across 68 events — making ranked, multi-FIR tracking more operationally useful than monitoring any single named airspace.
- Event count and total airspace-days lost do not correlate reliably: SKED reached 465 days from 31 events while UHMM logged 437 days from 38 events, meaning the duration of individual restrictions matters as much as how often disruptions occur.
Powered by B1KEY
Live tools behind the analysis.
The signals FlySafe writes about are also published live — continuously verified by the Sentinel pipeline.
Information is accurate as of the publication date. FlySafe uses exclusively publicly available data.