Natural hazards — volcanic ash, seismic activity, and tropical cyclones — accounted for approximately 66% of all confirmed airspace-days lost worldwide in 2026 to date, according to FlySafe collector data covering 1 January through 26 August 2026. Across that window, FlySafe's consensus engine confirmed 770 airspace-disruption events across 74 flight information regions (FIRs), totaling 6,655 airspace-days. Volcanic ash alone was responsible for 58% of that total — 3,863 airspace-days across 362 events — making it the single largest operational disruptor of the year, ahead of conflict-zone restrictions at 33%.
For flight planners, the finding carries a practical implication: the majority of 2026's airspace disruption originated not from restricted-airspace advisories but from geophysical and meteorological events, and a significant share of those events was not visible through NOTAM channels alone.
Volcanic Ash: The Largest Single Disruption Category
Three FIRs dominated the volcanic-ash category by airspace-days lost (FlySafe data, as of 2026-08-26):
| FIR | Airspace-days | Events |
|---|---|---|
| SEFG | 615.0 | 41 |
| SKED | 600.0 | 40 |
| SPIM | 562.0 | 38 |
Together, these three FIRs account for 1,777 airspace-days — roughly 46% of all volcanic-ash disruption days recorded in 2026. The clustering is operationally significant: sustained ash contamination in adjacent or regionally connected airspace compounds rerouting complexity, because alternates and diversion corridors may sit inside equally affected volumes.
The corroboration profile of these FIRs differs sharply. SKED and SPIM events were corroborated by FlySafe's own ADS-B flight-traffic collection in 100% of cases and by NOTAM signals in 100% of cases — meaning traffic measurably reacted to every confirmed event. SEFG, by contrast, showed 100% NOTAM corroboration but 0% flight-traffic corroboration, indicating that published restrictions there did not produce a detectable traffic response in FlySafe's ADS-B data. Both patterns matter for planning: the former confirms real operational impact; the latter flags airspace where the paper record and observed traffic behavior diverge, a distinction explored further in FlySafe's ranking of 2026's most-disrupted FIRs by NOTAM data.
Seismic Activity and Tropical Cyclones: Smaller Share, Concentrated Impact
Seismic activity produced 319 airspace-days (5% of the total) across 52 confirmed events. The category is heavily concentrated: MMFR absorbed 223 of those days — roughly 70% of the global seismic total — followed by MMID (25.0 days) and RJDG (21.0 days).
Tropical cyclones contributed 194 airspace-days (3%) across 43 events. ZSHA led with 119.0 airspace-days, followed by KZAK (22.0) and MMID (16.0). MMID's appearance in both the seismic and cyclone tables makes it a notable multi-hazard FIR in the 2026 dataset: two independent natural-hazard categories affected the same airspace within a single year.
Cyclone and seismic disruptions differ from ash events in duration dynamics, but the dataset's overall recovery figure applies across categories: the average confirmed disruption in 2026 ran approximately 8.6 airspace-days, and all 770 confirmed disruptions had ended as of 26 August, with 329 concluding in the final 30 days of the window. Comparable regional patterns are examined in FlySafe's analysis of Caribbean airspace disruption in 2026.
The Detection Gap: Why NOTAM-Only Monitoring Misses Most Events
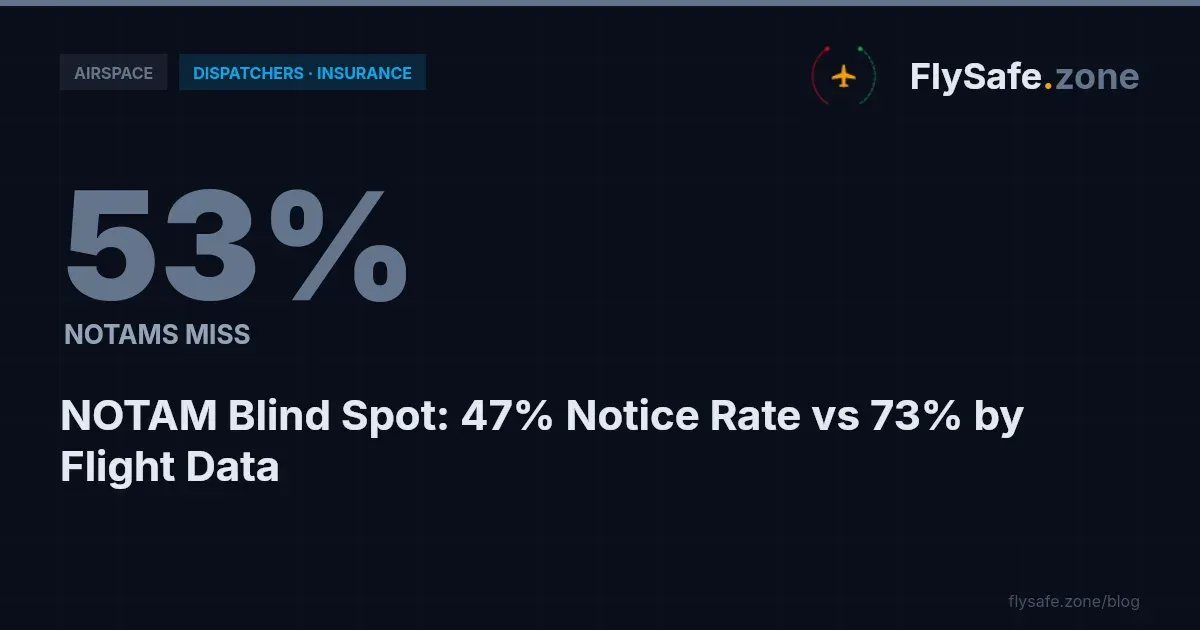
Among FIRs with at least three confirmed events, flight-traffic data corroborated approximately 73% of confirmed disruptions, while NOTAM signals corroborated only about 48%. A monitoring posture built exclusively on NOTAM review would therefore have missed the majority of confirmed disruptions in 2026.
Two FIRs illustrate the two failure modes:
- RPHI recorded 47 events and 521.0 airspace-days with 96% NOTAM corroboration but 0% flight-traffic corroboration — restrictions well documented on paper, without a measurable traffic signature in FlySafe's ADS-B collection.
- UUWV recorded 44 events and 539.0 airspace-days with 98% flight-traffic corroboration but only 84% NOTAM corroboration — observable traffic behavior changes that the NOTAM record alone did not fully capture.
FlySafe analysis shows that neither signal is sufficient in isolation. This is why the consensus engine requires at least two independent signals plus an attributed cause before an event is confirmed; detections with an undetermined cause are excluded from these figures entirely.
Recommendation: dispatch and flight-planning teams monitoring ash-, seismic-, or cyclone-prone FIRs should treat NOTAM review as necessary but not sufficient, and supplement it with traffic-behavior observation or third-party corroborated feeds.
The 2026 Timeline: A Steep Mid-Year Concentration
The monthly distribution of confirmed events was far from uniform (FlySafe data, as of 2026-08-26):
| Month | Confirmed events |
|---|---|
| January | 5 |
| February | 16 |
| March | 1 |
| April | 21 |
| May | 72 |
| June | 143 |
| July | 350 |
| August (through 26th) | 162 |
July alone accounted for 350 events — 45% of the year's total to date. The mid-year concentration means that annualized or quarterly averages understate the peak load on route-planning functions during June–August. Operators building contingency-fuel and reroute playbooks should plan against peak-month event density, not the year-to-date mean. The full FIR-level breakdown behind these totals is covered in FlySafe's report on the hardest-hit FIRs of 2026.
Regulatory Context
Several established frameworks govern how the disruptions in this dataset are published and managed:
- ICAO Annex 15 — Aeronautical Information Services — defines the NOTAM system through which states publish temporary airspace restrictions, including those triggered by volcanic ash, seismic events, and severe weather. The corroboration rates above measure events against exactly this publication channel.
- ICAO Annex 11 — Air Traffic Services — establishes FIR structure and the responsibility of air traffic services for traffic within each region; all figures in this bulletin are aggregated at the FIR level accordingly.
- ICAO Annex 19 — Safety Management — requires operators to maintain safety-management systems that incorporate hazard identification; multi-source disruption monitoring of the kind described here feeds that process.
- ICAO Doc 4444 (PANS-ATM) — governs air traffic management procedures applied when traffic is rerouted around affected volumes.
- 14 CFR Part 91 (FAA) and EU Regulation 965/2012 (Air Operations) — impose operator-level obligations for pre-flight information review and operational control, which extend to the natural-hazard advisories underlying the ash, seismic, and cyclone events counted here.
- EASA Conflict Zone Information Bulletins — relevant to the conflict-zone-restriction category (33% of 2026 airspace-days), which sits outside the natural-hazard scope of this bulletin. Where a CZIB exists without a supporting state-level restriction, the correct characterization is advisory only, not a closure.
Methodology & Provenance
- Window: 2026-01-01 through 2026-08-26. All figures as of 2026-08-26.
- Confirmation standard: an event is counted only when at least two independent signals agree and a cause has been attributed. Undetermined-cause detections are excluded.
- Inputs: public NOTAM data, EASA publications, FAA temporary flight restrictions, public volcanic-ash and seismic advisories, and FlySafe's own ADS-B flight-traffic collection, which serves as the primary corroborating signal.
- Cause categories: neutral operational classifications only — volcanic ash, seismic activity, tropical cyclones, conflict-zone restrictions, other regulatory restrictions.
- Honest gaps: the dataset does not include cost estimates, carrier-level rerouting decisions, or specific NOTAM identifiers for individual events; none are cited here. Per-event altitude-band detail is not currently available in the aggregate figures.
FlySafe's analysis is based exclusively on publicly available, independently verifiable data. FlySafe is not an operational authority; this bulletin does not constitute operational guidance, and dispatch decisions must rely on official state AIS publications and operator procedures.
Key Takeaway
Natural hazards — not conflict-zone restrictions — drove roughly two-thirds of the 6,655 airspace-days lost across 74 FIRs in 2026 to date, with volcanic ash alone at 58%. The events concentrated sharply in mid-year, averaged 8.6 airspace-days each, and — critically — were missed by NOTAM-only review in the majority of cases. Multi-signal monitoring that pairs official publications with observed flight-traffic behavior is the difference between seeing 48% of confirmed disruptions and seeing 73%.
FlySafe continuously tracks confirmed airspace disruptions worldwide using its two-signal consensus methodology. Flight-planning and dispatch teams can use FlySafe's FIR-level disruption data to benchmark exposure on ash-, seismic-, and cyclone-prone routes before the next peak season.
- Volcanic ash was the single largest source of airspace disruption in 2026, responsible for 58% of all confirmed airspace-days lost (3,863 days across 362 events) — outpacing conflict-zone restrictions at 33%.
- Three adjacent FIRs (SEFG, SKED, SPIM) account for 46% of all volcanic-ash disruption days, meaning reroutes and alternates in that region may fall inside equally affected airspace volumes.
- NOTAM records and observed flight traffic diverge in a measurable share of events: SEFG showed 100% NOTAM corroboration but 0% ADS-B traffic response, while SKED and SPIM showed 100% corroboration on both — a operationally meaningful distinction for planners relying solely on NOTAM feeds.
- MMID appears in both the seismic and tropical cyclone disruption tables, making it a multi-hazard FIR where independent natural-hazard categories compound planning exposure.
Powered by B1KEY
Live tools behind the analysis.
The signals FlySafe writes about are also published live — continuously verified by the Sentinel pipeline.
Information is accurate as of the publication date. FlySafe uses exclusively publicly available data.