Every one of the 710 confirmed airspace disruptions recorded across the first eight months of 2026 has now ended. According to FlySafe airspace-risk collectors (data as of 2026-08-21), 710 of 710 confirmed events have lifted, 344 of them within the last 30 days, and the average confirmed disruption ran roughly 8.5 airspace-days. This bulletin summarizes what has recovered, what the year-to-date record looks like, and what the recovery pattern means for route planning. FlySafe analysis is based exclusively on publicly available, independently verifiable data.
The Year-to-Date Record
Across the window 2026-01-01 to 2026-08-21, FlySafe collectors confirmed 710 airspace-disruption events spanning 73 FIRs, totaling 6,044 airspace-days. Only confirmed events are counted here: each requires at least two independent signals and an attributed operational cause, with undetermined-cause detections excluded. That filter is deliberate — it separates verified operational status from raw, unconfirmed noise.
The word "recovery" carries a specific meaning in this dataset. A disruption is treated as ended when the operational restriction that defined it is no longer in force. On that basis, the recovery rate for the year to date is complete: 710 of 710 confirmed disruptions have closed out. The typical event was short — about 8.5 airspace-days — though the distribution is uneven, as the FIR-level figures below show.
The monthly confirmed-event trend illustrates how activity built and then began to unwind:
| Month | Confirmed events |
|---|---|
| January | 5 |
| February | 16 |
| March | 1 |
| April | 21 |
| May | 72 |
| June | 143 |
| July | 350 |
| August (to 21st) | 102 |
July stands as the peak month for newly confirmed events, with the August partial-month count running well below it. Because event confirmation and event recovery are tracked separately, a high monthly event count does not by itself indicate persistent restriction — many of those July events fall within the 344 disruptions that lifted in the most recent 30 days.
Which FIRs Lost the Most Days
Airspace-days — the count of days a given volume was affected — is the more durable measure of operational impact than raw event counts. The most-affected FIRs by airspace-days for the year to date were:
| FIR | Events | Airspace-days | Flight-traffic corroboration | NOTAM corroboration |
|---|---|---|---|---|
| Damascus (OSTT) | 72 | 820.0 | 26% | 72% |
| SEFG | 36 | 540.0 | 0% | 100% |
| SKED | 35 | 525.0 | 100% | 100% |
| RPHI | 47 | 515.0 | 0% | 96% |
| SPIM | 33 | 490.0 | 100% | 100% |
| UUWV | 40 | 487.0 | 98% | 83% |
Damascus FIR (OSTT) carried the largest single-FIR burden at 820 airspace-days across 72 events. The corroboration columns are worth reading closely: they show how each FIR's disruptions were verified, and they vary widely. Some FIRs — SKED and SPIM among them — were corroborated by both flight-traffic observation and NOTAM in every confirmed event. Others, such as SEFG and RPHI, showed near-total NOTAM corroboration but little or no independent flight-traffic signal, while UUWV was corroborated overwhelmingly by flight-traffic.
All events feeding these totals have since ended. The airspace-day figures therefore describe cumulative impact over the window, not current status. For route planners, the distinction matters: a FIR that topped the annual airspace-days table is not, by that fact alone, restricted today.
For a deeper ranking of the year's most-affected regions, see the FlySafe breakdown of 2026's most-disrupted FIRs by NOTAM data.
Why NOTAM-Only Review Misses Disruptions
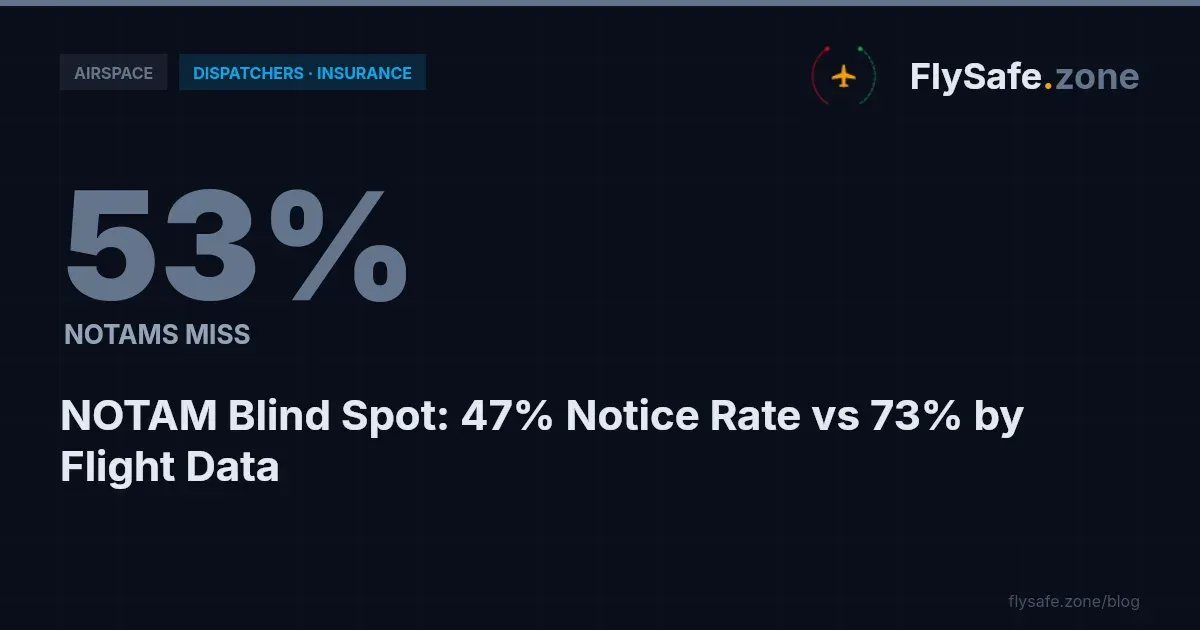
The corroboration columns above point to a broader finding in the data. Across FIRs with at least three confirmed events, flight-traffic observation corroborated roughly 74% of events, while NOTAM corroborated roughly 47%. In other words, a review built on NOTAM notices alone would miss the majority of confirmed disruptions.
This is a methodological point with operational consequences. NOTAMs are the formal notice mechanism, but they are not always issued, not always timely, and not always aligned with observed traffic behavior. FlySafe's own ADS-B flight-traffic collection serves as the primary corroborating signal precisely because it captures what aircraft actually do — rerouting, level changes, avoidance — independent of whether a paper notice was filed. When both signals agree, confidence is high; when they diverge, the gap itself is informative.
The practical takeaway is that recovery, like disruption, should be confirmed against traffic behavior and not against notice cancellation alone. A NOTAM being lifted is one signal; traffic returning to normal routing through the volume is another. FlySafe's consensus approach treats the combination as the standard. The pattern is examined in more detail in the analysis of how NOTAMs miss most airspace disruptions in 2026.
The Operational Category Mix
Confirmed disruptions are grouped into neutral operational categories. By airspace-days across the year to date, the mix was:
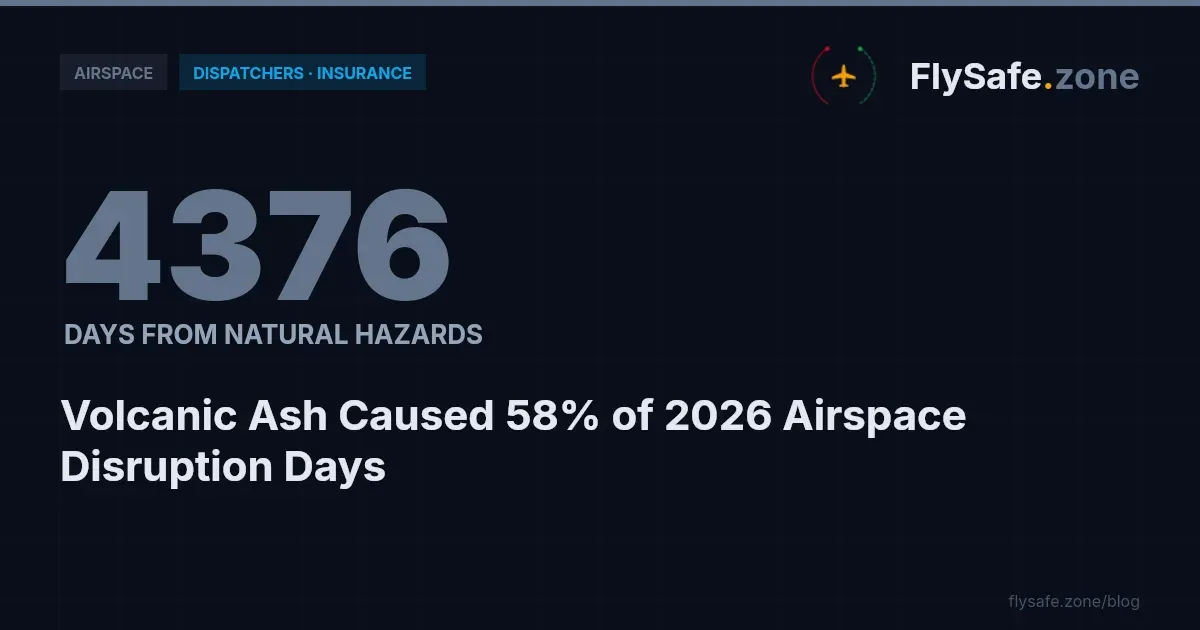
- Volcanic ash — 57% (3,441 days, 326 events)
- Conflict-zone restrictions — 34% (2,031 days, 254 events)
- Seismic activity — 5% (315 days, 50 events)
- Tropical cyclones — 3% (160 days, 34 events)
- Other regulatory restrictions — 2% (97 days, 46 events)
Volcanic ash accounted for the largest share of airspace-days, a reminder that natural-hazard factors — ash, seismic activity, and tropical cyclones together making 65% of airspace-days — dominate the operational picture as much as regulatory conflict-zone restrictions. Ash and cyclone events tend to be geographically mobile and time-limited, which is consistent with the short average duration observed across the dataset. For planners, this category mix reinforces that airspace status is a moving picture driven substantially by environmental factors, and that recovery in one category does not generalize to another.
What Full Recovery Means for Route Planning
The headline for operators is that the year-to-date confirmed disruptions have all lifted, but that is a statement about the past, not a forecast. Airspace status changes continuously, and a clean recovery record for events already logged says nothing about volumes that may be affected tomorrow. The operational implication is procedural rather than predictive:
Airspace status: all 710 confirmed disruptions for the window are recorded as ended as of 2026-08-21; no year-to-date confirmed event remains active in the dataset.
Recommendation: plan against current published notices and live traffic signals rather than against historical airspace-day tables. A FIR's high annual impact does not indicate present restriction, and a lifted NOTAM should be cross-checked against observed traffic before a route is treated as fully restored.
FlySafe analysis shows that the most reliable read of recovery combines formal notice status with independent flight-traffic corroboration — the same two-signal standard used to confirm the disruptions in the first place. Related regional context is available in the FlySafe reviews of why Caribbean airspace status shifted in 2026 and which UAE-area FIRs lost the most days.
Regulatory Context
Several frameworks govern how the statuses described here are declared, notified, and acted upon. Under ICAO Annex 11 — Air Traffic Services, states are responsible for the air traffic services within their FIRs, including the establishment and lifting of restricted volumes. ICAO Annex 15 — Aeronautical Information Services — governs the NOTAM and AIP mechanisms through which those changes are formally published; the corroboration gap noted above is, in part, a function of how consistently states exercise these Annex 15 obligations.
For operators, EU Regulation 965/2012 (Air Operations) and the equivalent national operating rules — including 14 CFR Part 91 in the United States — place responsibility on the operator to plan around published restrictions. EASA Conflict Zone Information Bulletins (CZIB) provide advisory-level guidance for the conflict-zone-restriction category; per the terminology used in this bulletin, a CZIB is advisory only unless a state CAA adopts it via NOTAM or AIP. ICAO Annex 19 (Safety Management) frames the data-driven monitoring approach that underlies consensus-based status assessment.
Methodology and Provenance
FlySafe's consensus engine requires at least two independent signals per event, with FlySafe's own ADS-B flight-traffic collection serving as the primary corroborating signal. Inputs are public NOTAM, EASA, FAA TFR, volcanic-ash, and seismic advisories, combined with FlySafe ADS-B observation. Only confirmed events — those with two or more independent signals and an attributed cause — are counted; undetermined-cause detections are excluded. All figures are year-to-date for 2026-01-01 to 2026-08-21, sourced from FlySafe airspace-risk collectors as of 2026-08-21.
Analysis based on publicly available data only. FlySafe is not an operational authority and does not issue NOTAMs, clearances, or airspace determinations. Operators must consult official NOTAMs, AIP entries, and their national aviation authority before any flight-planning decision. This bulletin reports disruption metrics and does not attribute or interpret any underlying cause.
For live airspace-risk monitoring and FIR-level recovery tracking, explore FlySafe.
- All 710 confirmed airspace disruptions recorded year-to-date across 73 FIRs have closed out as of 2026-08-21, totaling 6,044 airspace-days at an average of ~8.5 days per event — the dataset is now in full recovery.
- July was the peak month with 350 newly confirmed events, yet 344 disruptions lifted within the last 30 days — meaning a high monthly event count does not indicate persistent restriction; confirmation and recovery are tracked separately and can cluster together.
- Damascus FIR (OSTT) carried the largest single-FIR load at 820 airspace-days across 72 events; corroboration rates vary sharply across top FIRs — some show 0% flight-traffic corroboration — meaning no single data source reliably captures all disruptions.
Powered by B1KEY
Live tools behind the analysis.
The signals FlySafe writes about are also published live — continuously verified by the Sentinel pipeline.
Information is accurate as of the publication date. FlySafe uses exclusively publicly available data.