Orlando Sanford (SFB) Observed Traffic −63%: Airline Flights Held, the Training Fleet Stood Down Under Low Cloud — October 2026
- Our count at Sanford fell to 130 movements on 7 October (settled at 132), −71% against recent Wednesdays — but scheduled airline movements were not reduced; the shortfall was local training and private flying.
- Sanford reported low cloud and heavy rain for most of the day, and small airports across central Florida dropped together, while Orlando International, Tampa and Jacksonville were ordinary.
- It recovered with the weather: 493 observed movements on Friday 9 October with the training fleet at 327, then 366 on Sunday and 656 on Monday 12 October. Hurricane Isaias passed no closer than about 535 km (Florida panhandle coast, 10 October) and was post-tropical by that morning. This page is closed; for a specific flight, check your airline and the airport.
Advisory timeline — how active is this episode
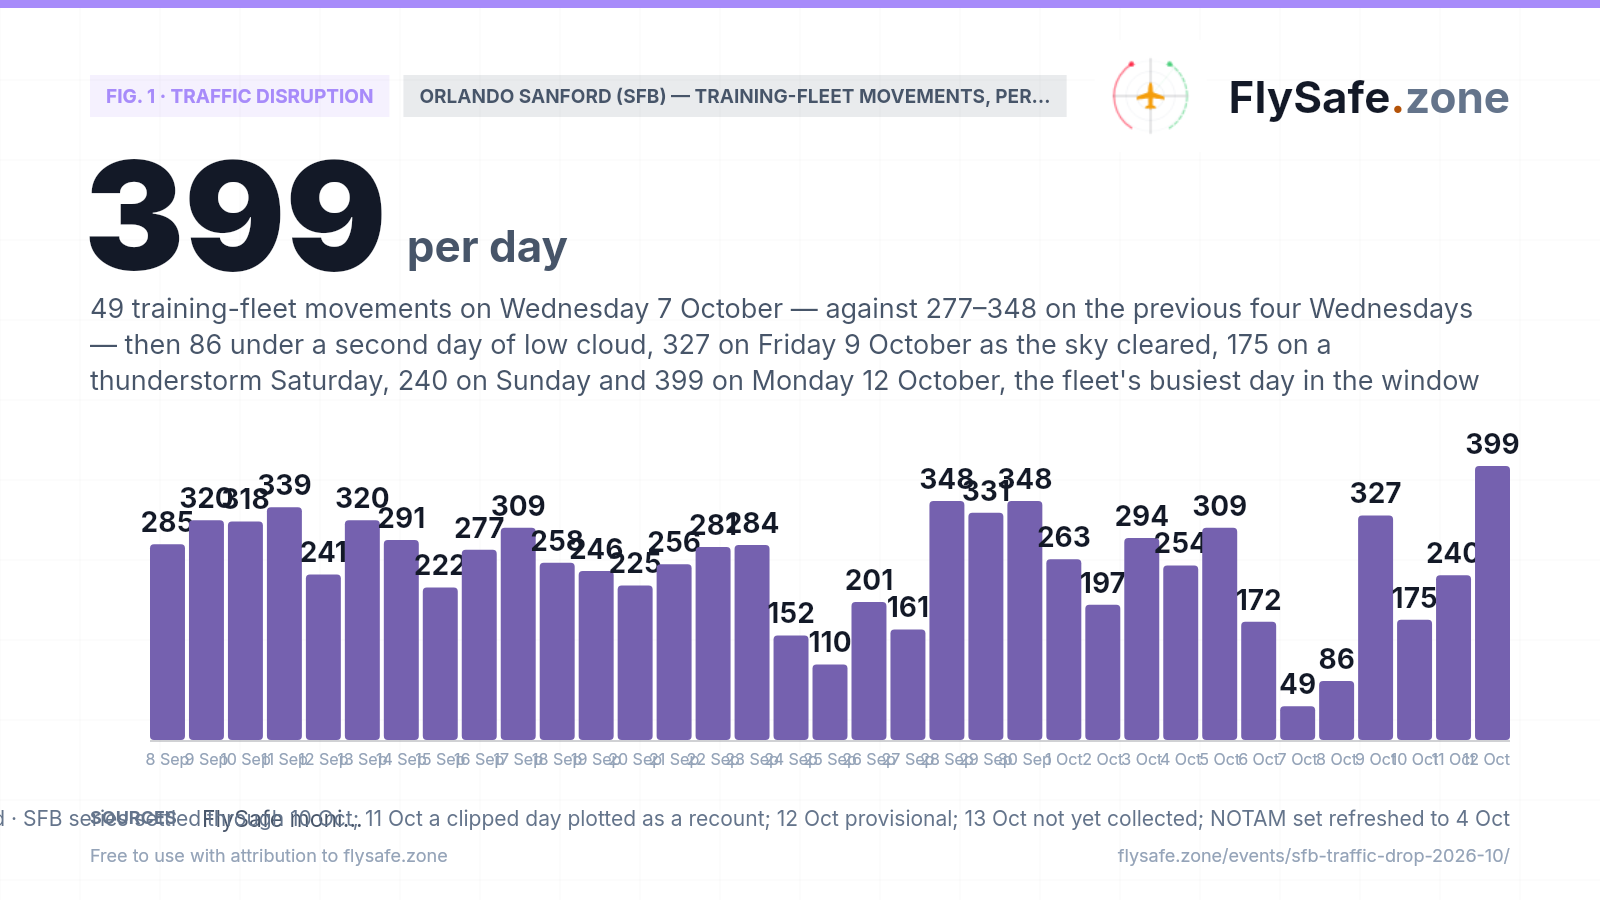
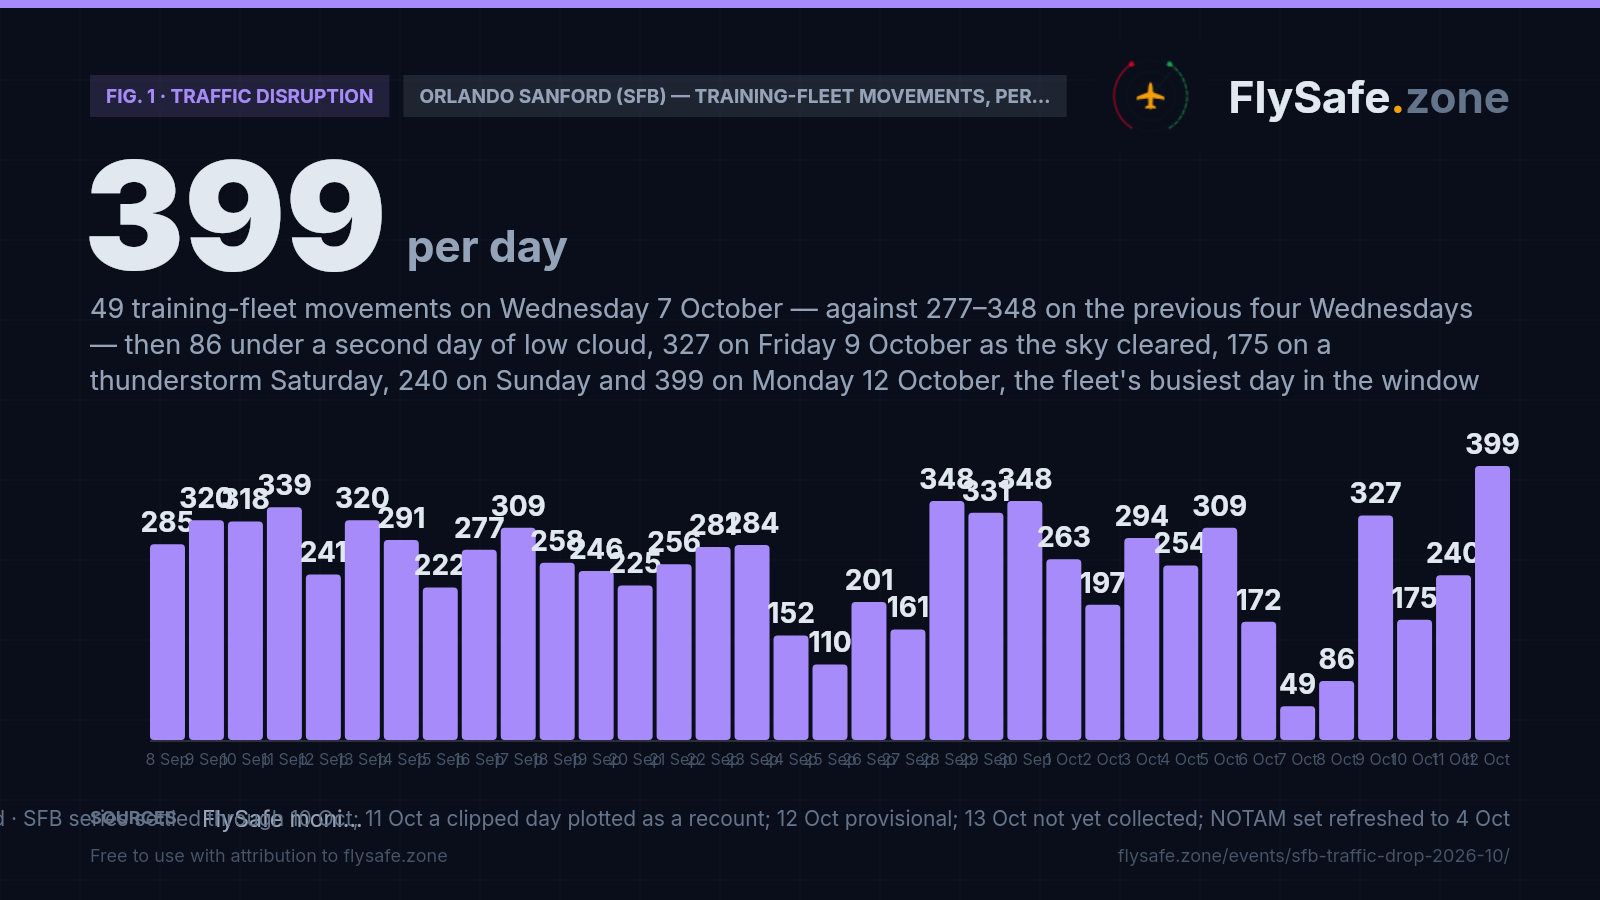
This chart isolates the part of Sanford's traffic that actually moved. Over the eight days to 5 October, one callsign family accounted for 2,344 of the airport's 3,585 observed movements — 65%. It is a fleet of 63 airframes flying sorties of about 69 minutes on average, and 86% of its Sanford departures land back at Sanford: the signature of flight training (that last word is our interpretation of the pattern, not a measurement). On a normal Wednesday it logs 277–348 movements. On Wednesday 7 October it logged 49 — the lowest day in the 30-day window by a wide margin. The one earlier dip of similar shape, 152 and 110 on 24–25 September, coincided with a run of marginal-VFR reports at nearby Orlando International, and the fleet was back at 348 on Monday 28 September. The 7 October bar settled on 11 October at 49, unchanged from the provisional count. Recovery followed the weather: 86 on Thursday 8 October under a second day of low cloud, 327 on Friday 9 October with 59 of the 63 airframes flying, 175 on a Saturday of thunderstorm reports around Orlando, 240 on Sunday 11 October — the fleet's mean on the four previous Sundays, to the movement — and 399 on Monday 12 October, its busiest day in the window. The 11 October bar is a recount from raw records on a day our trailing refresh clipped; the 12 October bar is provisional until 16 October and may still rise; 13 October is not plotted because our record for it holds about a tenth of a normal day.
Fig. 1 — Observed daily movements at Orlando Sanford International (SFB) by the airport's largest callsign family — a fleet flying short sorties that mostly end back at Sanford — 8 Sep – 12 Oct 2026; 11 Oct recounted from raw records on a day our refresh clipped, 12 Oct provisional until 16 Oct · * partial day · Data as of 14 Oct 2026, 21:58 UTC · closed · SFB series settled through 10 Oct; 11 Oct a clipped day plotted as a recount; 12 Oct provisional; 13 Oct not yet collected; NOTAM set refreshed to 4 Oct · Source: FlySafe monitoring (crowdsourced ADS-B receiver network).
Airports in the exposure zone
| Airport | Size | Observed signal | FIR |
|---|---|---|---|
| Orlando Sanford International Airport (SFB) | medium | — · Wed 7 Oct: 132 observed, settled (68 dep / 64 arr) vs ~452 Wednesday mean (−71%) · training fleet 49 vs ~307 · airline 44, not reduced · IFR in 11 of 16 weather reports · recovered: Fri 9 Oct 493 (fleet 327), Sun 11 Oct 366, Mon 12 Oct 656 | KZJX |
| Orlando International Airport (MCO) | large | 39 km · Same metro, same feed: 894 observed on 7 Oct (settled; 883 provisional) against 792 on Wed 30 Sep — ordinary; 7 IFR and 8 MVFR among 32 weather reports that day · 1,075 on Fri 9 Oct, 1,055 on Mon 12 Oct | KZJX |
| Tampa International Airport (TPA) | large | 155 km · 532 observed on 7 Oct (settled; 524 provisional) against 473 on Wed 30 Sep — ordinary · 567 on Fri 9 Oct, 601 on Mon 12 Oct | KZJX |
Distance alone does not determine impact — wind direction and the flight levels the ash reaches decide which airports and routes are affected on a given day. FIR = Flight Information Region.
What our monitoring shows: airline flights held, local training sorties fell away — and came back with the weather
FlySafe tracks observed departures and arrivals at 493 airports from crowdsourced ADS-B receiver data. Observed counts are a floor, not a total — receiver coverage varies — but an airport measured against its own baseline is a reliable shape. Orlando Sanford International's last 30 days:
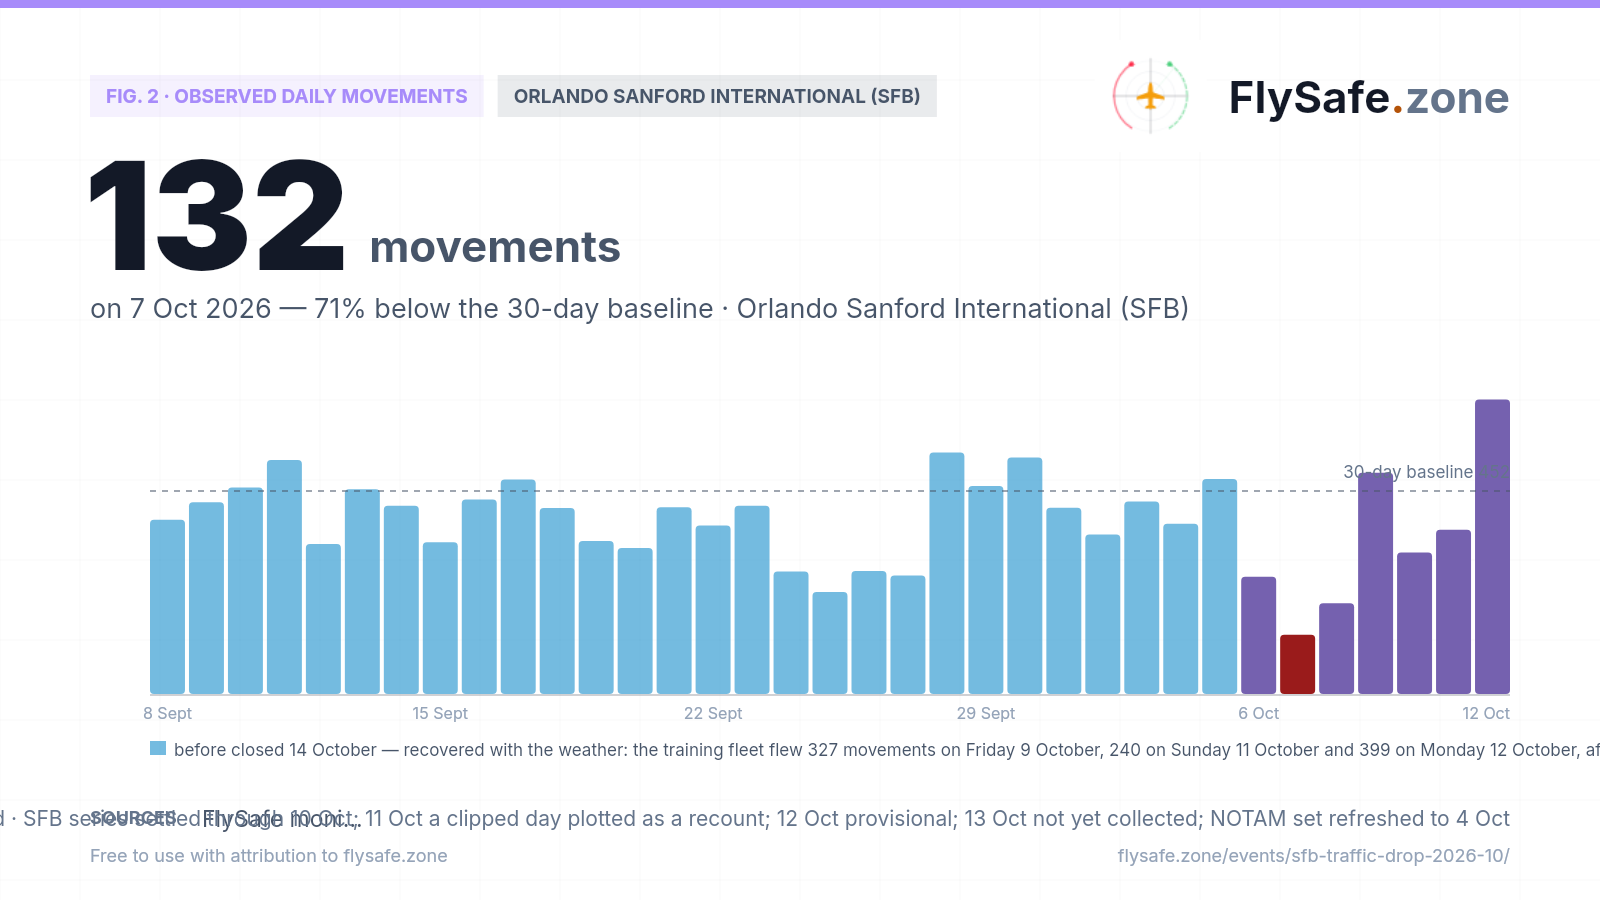
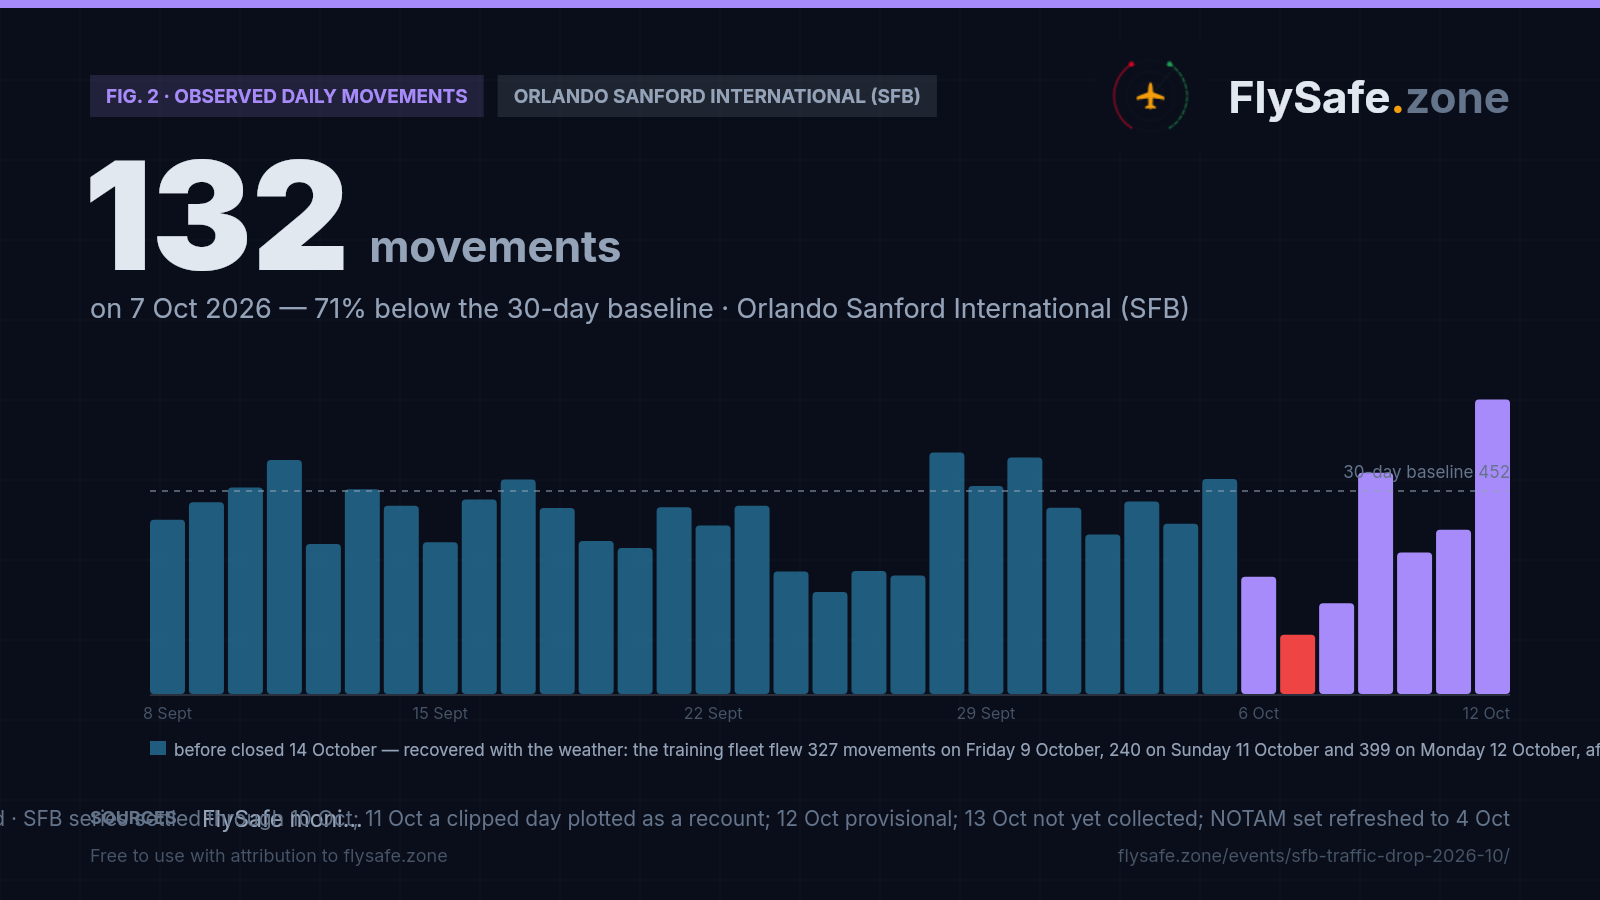
Fig. 2 — Observed daily movements at SFB, 8 Sept – 12 Oct (latest complete UTC day). Data as of 14 Oct 2026, 21:58 UTC · closed · SFB series settled through 10 Oct; 11 Oct a clipped day plotted as a recount; 12 Oct provisional; 13 Oct not yet collected; NOTAM set refreshed to 4 Oct · Source: FlySafe monitoring (ADS-B receiver network).
- Wednesday 7 Oct: 132 observed movements, settled (68 departures, 64 arrivals; the provisional count this page opened with was 130) — −71% against the ~452 mean of the four previous Wednesdays (427, 433, 419, 527). The detection layer fired at −63% against the 348 seven-day all-days average (−62% on the settled count); the same-weekday comparison is the stricter one, and it reads deeper. It was not a collection gap: our worldwide count for 7 October settled at 260,632 movements, in line with the surrounding weekdays (250,000–266,000).
- Tuesday 6 Oct: 261, settled — −33% against the ~391 mean of the four previous Tuesdays (388, 338, 375, 463). The recount we plotted while the stored rollup read a clipped 251 settled at exactly 261 on 10 October. The decline began on the 6th and deepened on the 7th.
- Where the drop sat: the training-fleet callsign family (chart above) logged 49 movements on 7 Oct against a ~307 Wednesday mean — −84% — with 20 of its 63 airframes flying. Privately registered aircraft flying under their registration number settled at 26 against ~95 (−73%). Between them, those two groups account for nearly the whole shortfall.
- What did not drop: scheduled airline movements. Sanford's based low-cost carrier (callsign family AAY) settled at 44 movements on 7 October — more than on any of the four previous Wednesdays (12, 14, 18, 26) — then 59, 79, 74, 66, 79 from 8 to 12 October: on every one of those days at or above the highest of its four previous same weekdays. Its schedule varies by day, so we draw no conclusion from the rise; the point is that the airline layer showed no shortfall at any point.
- Thursday 8 Oct: 202 (108 departures, 94 arrivals) — −50% against ~407 on the four previous Thursdays (460, 478, 273, 415), with the training fleet at 86 (33 airframes). Sanford's weather station reported IFR or lower in 10 of its 28 observations that day; Orlando International filed 9 IFR and 11 marginal-VFR reports among 37.
- Friday 9 Oct: 493 — the recovery day. 249 departures, 244 arrivals: +30% against ~379 on the four previous Fridays (521, 414, 227, 355) and the highest Friday in the window. The training fleet flew 327 movements with 59 of its 63 airframes — 164 departures, 88% of them landing back at Sanford, sorties of about 62 minutes — against 339, 258, 110 and 197 on the previous four Fridays. Sanford reported VFR in 22 of 26 observations (2 IFR, 2 marginal). Settled 13 October.
- Saturday 10 Oct: 315 (156 / 159) — −9% against ~345 on the four previous Saturdays (334, 341, 274, 429); fleet 175 (49 airframes) against 201–294. Thunderstorms were reported at Sanford (1 of 24 observations), Orlando International (3 of 31, with 6 IFR) and Daytona Beach (7 of 32, gusts to 26 knots) that day. Settled 14 October.
- Sunday 11 Oct: 366, recounted (186 / 180) — +3% against ~356 on the four previous Sundays (456, 325, 264, 379); fleet 240 (55 airframes), the mean of its four previous Sundays to the movement; 22 of 26 weather observations VFR, none IFR. The stored daily rollup reads 56 because our trailing refresh at 21:25 UTC today clipped the day, which is why the airport page flags it as a gap — an artefact the nightly pass should restore. Our worldwide record for 11 October stands at ~91% of the two previous Sundays, so this count may still rise.
- Monday 12 Oct: 656, provisional (324 / 332) — +42% against ~463 on the four previous Mondays (419, 416, 538, 479) and the busiest day in the 35-day window (previous high 538 on 28 September). The training fleet flew 399 (57 airframes; 199 departures, 85% back to Sanford, sorties of about 70 minutes), its own busiest day (previous high 348); private registrations 152 (previous high 114). All 24 Sanford observations and all 32 at Orlando International were VFR. The day was a US federal holiday; we note it and draw nothing from it. It settles on 16 October; our worldwide record for it stands at ~94% of the two previous Mondays, so it may still rise. We report the high day as measured and do not read it as a trend — observed counts are a floor from a receiver network whose coverage is not constant.
- Second, independent feed: a separate ADS-B source read SFB at 82 and 73 on 6–7 Oct against 111–144 on 1–5 Oct, then 100, 144, 135, 146, 188 from 8 to 12 Oct. It agrees on the shape — a two-day trough, then back at or above its early-October level from the 9th — not on depth: that feed hears about a quarter of the movements ours does at Sanford, so the two are not sampling the same mix of flights, and we do not pick between them.
- Gap days, labeled: no collection-gap day in the 8 Sep – 12 Oct window as plotted; 11 October is a recount on a clipped day and 12 October is provisional (both marked above). Tuesday 13 October is not plotted: our flight record was last ingested at 02:34 UTC on 14 October and holds about a tenth of a normal day worldwide (3 movements at Sanford), so we make no claim about it.
Observed counts are a floor, not a total — our receiver network does not hear every movement, especially low-level local flying. Live view: SFB airport brief.
What it means for flights
What fired, and why we publish it. Our detection layer flagged SFB when the 7 October observed count came in at 130 movements against a seven-day average of 348 — a −63% traffic anomaly at a Florida airport with scheduled passenger service. Automated multi-signal analysis then cross-checked it against every other layer we track: same-weekday history, callsign composition, hourly shape, weather reporting, closure events, temporary flight restrictions, GNSS integrity, volcanic-ash exposure, neighbouring airports and a second independent ADS-B feed. Unlike a weekly-rhythm false alarm, this one is a real drop in observed flying — and the cross-checks say clearly which flying. We publish it because a raw −63% at an airline airport invites the wrong reading, and the composition is what tells a traveller whether it matters to them.
Sanford's observed traffic is mostly training, and training is weather-sensitive. Over the eight days to 5 October, 65% of Sanford's observed movements came from one callsign family: 63 airframes, sorties of about 69 minutes, 86% of departures returning to Sanford. Another ~18% are privately registered aircraft. Scheduled airline movements are a minority of what our receivers count here. That mix matters, because instruction and private flying are largely visual — and when cloud sits a few hundred feet above the ground, visual flying largely stops while instrument-rated airline operations continue. That is the mechanism we believe explains this event; it is interpretation built on measurements, and we label it as such. What is measured: the training family fell 84% against its Wednesday mean, private registrations fell 74%, and the airline count did not fall at all.
The weather on 7 October. Sanford's weather station reported IFR or lower in 11 of its 16 observations on 7 October (4 marginal VFR, 1 VFR), with broken-to-overcast cloud between 400 and 1,200 ft through most of the local day, heavy rain in several reports and 1.95 inches of rain in the six hours to 17:53 UTC; winds stayed at 12 knots or less, with no thunderstorm reported. One caveat: our record for this station begins at 11:28 UTC on 7 October, so we hold no earlier Sanford observations and no 30-day weather baseline for it. Orlando International, 39 km away, fills that gap: 7 IFR and 8 marginal-VFR reports among 32 on 7 October (1 IFR and 6 MVFR on the 6th), against IFR on only two days between 8 and 30 September. Daytona Beach reported IFR in 17 of 38 observations on the 7th. Conditions were still poor on 8 October — 10 of Sanford's 28 reports were IFR — so the next day's count may also be low.
The geography test: small fields fell together, airline hubs did not. Each airport against the previous Wednesday, 30 September (single-day comparisons, provisional for 7 October): general-aviation and training fields across central Florida all dropped — Daytona Beach −76% (202 vs 854), Melbourne −63% (142 vs 382), Kissimmee −67% (55 vs 165), Orlando Executive −53% (112 vs 240), New Smyrna Beach −90% (19 vs 191). The airline hubs did not: Orlando International +11% (883 vs 792), Tampa +11% (524 vs 473), Jacksonville +4% (263 vs 253), Miami +10% (1,158 vs 1,049), Fort Lauderdale flat (559 vs 558). A receiver-coverage loss would not sort airports by the kind of flying they host; weather that stops visual flying would. This is also why the drop is not Sanford's alone and why we tag the Jacksonville FIR (KZJX), which covers central Florida, as the affected area.
It has happened before — inside our own 30-day window. On 24–25 September Sanford read 273 and 227 movements, with the training family at 152 and 110. Orlando International filed 15 and 17 marginal-VFR reports on those two days, against none on most September days. By Monday 28 September Sanford was back at 538, its busiest day of the window. The October drop is deeper, under worse cloud, but it has the same shape: the training fleet goes quiet, the airline count does not, and recovery follows the weather.
The independent checks we ran. No airspace-closure event stands for the Jacksonville FIR (KZJX) in our detection layers: six have ever been recorded there, all in a late-May to 1-June cluster, and every one has since been invalidated by our own integrity checks. No FIR-level traffic anomaly has been logged for KZJX since 1 October. The temporary flight restrictions we hold for Florida on 6–7 October are standing security areas elsewhere in the state; none covered Sanford. The GNSS-integrity indicator for SFB is low, with a seven-day interference ratio of zero, and there is no ash exposure. Collection was complete: our worldwide count for 7 October is 105% of its 14-day median.
Hurricane Isaias — what we can and cannot say. The US National Hurricane Center's 03:00 UTC advisory on 9 October places Hurricane Isaias at 25.4°N 88.4°W in the central Gulf of Mexico, 90 knots, 969 hPa, moving northeast at 14 knots — about 800 km west-southwest of Sanford. On 7 October, the day of the flag, it was a tropical storm near 22°N in the western Gulf, roughly 1,200–1,600 km away. We do not attribute Sanford's 7 October weather to it; our data cannot establish that link. We also publish no track forecast of our own — the official forecast cone is the Hurricane Center's. If closures, restrictions or a traffic signal tied to the storm appear in the Jacksonville FIR, this page will report them.
What we cannot say, and what changes this page. Observed counts are a floor, not a total — our receiver network does not hear every movement, and low-level local flying is the hardest kind to hear. We make no claim about Sanford's schedule-level totals, about individual cancellations, or about any flight's status; that belongs to the airport, the airlines and the FAA, who work from their own complete data. Three things will move this page: the settled 7 October count (from 11 October); the counts for 8 and 9 October, as the weather clears or does not; and any closure, restriction or storm-related signal in the Jacksonville FIR. We will close it when the training family is back inside its normal range under ordinary weather, and say so with the number.
What the data showed — close-out, 14 October. The number. Wednesday 7 October settled on 11 October at 132 observed movements (68 departures, 64 arrivals), two more than the provisional 130 this page opened with: −71% against the ~452 mean of the four previous Wednesdays and −62% against the 348 seven-day average that tripped the detection layer. The training-fleet count stayed at 49 (20 of the fleet's 63 airframes flew); privately registered aircraft settled at 26, the based carrier at 44. The recovery. Thursday 8 October was a second low day — 202 movements, −50% against ~407 on the four previous Thursdays, with the fleet at 86 as Sanford reported IFR or lower in 10 of 28 observations. Then the cloud lifted. Friday 9 October measured 493 observed movements (249 departures, 244 arrivals) against 521, 414, 227 and 355 on the four previous Fridays, with 22 of Sanford's 26 weather observations VFR; the training fleet flew 327 movements with 59 of its 63 airframes — 164 departures, 88% of them landing back at Sanford, sorties of about 62 minutes — against 339, 258, 110 and 197 on previous Fridays, and inside the 277–348 band of its normal Wednesdays. Saturday 10 October read 315 (−9% against ~345 Saturdays) with the fleet at 175 against 201–294, on a day when Sanford, Orlando International and Daytona Beach all reported thunderstorms. Sunday 11 October, recounted from raw records, read 366 (+3% against ~356 Sundays) with the fleet at 240 — the mean of its four previous Sundays, to the movement. Monday 12 October read 656, the busiest day in the window (previous high 538 on 28 September), with the fleet at 399 (57 airframes), its own busiest day, and private registrations at 152, under 24 VFR observations out of 24. The Monday was a US federal holiday; we note it and draw nothing from it. The last two days are not final: the 11 October rollup is clipped in our store (56), so the airport page flags it as a gap until the nightly refresh restores it; 12 October settles on 16 October; and our worldwide record for those two days stands at 91–94% of the previous same weekdays, so either may still rise. 13 October is not measurable — our flight record was last ingested at 02:34 UTC on 14 October and holds about a tenth of a normal day. What never fell. The based carrier's count ran 44, 59, 79, 74, 66 and 79 from 7 to 12 October — on every one of those days at or above the highest of its four previous same weekdays. Its schedule varies by day and we read nothing into the rise; the point is that the airline layer showed no shortfall at any point. The geography, settled. The 7 October figures in the geography section settled within a few movements of the provisional values — Daytona Beach 209, Melbourne 144, Kissimmee 57, Orlando Executive 114, New Smyrna Beach 19; Orlando International 894, Tampa 532, Jacksonville 269, Miami 1,181, Fort Lauderdale 568 — and none changed sign. By Friday 9 October the general-aviation fields were back at or near their previous Friday (Daytona Beach 529 vs 400, Melbourne 320 vs 254, Orlando Executive 241 vs 184, New Smyrna Beach 185 vs 83, Kissimmee 141 vs 147), and on Monday 12 October five of the six read above their previous Monday (Melbourne, 365 vs 427, the exception). The other layers. No traffic anomaly for the Jacksonville FIR (KZJX) from 1 October to this close-out; no closure event there since the late-May to 1-June cluster, all six entries of which our integrity checks invalidated; no closure notice for the aerodrome in our NOTAM set, which was last refreshed on 4 October and so speaks for the period to that date; the temporary flight restrictions in Florida on 6–14 October (feed refreshed 18:00 UTC on 14 October) were hazard, space-operations, security, event and VIP areas elsewhere in the state — from Cape Canaveral and Daytona Beach to Mayport, Tampa and West Palm Beach, plus the standing Disney World security area — none over Sanford; GNSS interference for the FIR read 0.0001–0.0005 on every day from 1 to 13 October, at its floor; no ash exposure. Hurricane Isaias. By the National Hurricane Center's positions the storm peaked at 105 knots in the northern Gulf on 9 October, passed closest to Sanford at about 535 km around 01:00 UTC on 10 October as a 90-knot hurricane near 30.2°N 86.5°W on the Florida panhandle coast, and was classed post-tropical from 06:00 UTC that day over Alabama; the last advisory, at 15:00 UTC on 11 October, placed the remnant over Kentucky at 20 knots. The thunderstorm reports around Orlando on 10 October coincided with that passage; our data cannot establish the link and we do not attribute them. No closure, restriction or traffic signal tied to the storm appeared in the Jacksonville FIR. What this adds up to. A real drop in observed flying, concentrated in weather-sensitive local training and private flights, under two days of IFR cloud, with the airline layer untouched throughout — and a return to normal and then above-normal counts within two days of the sky clearing. That the weather caused the stand-down remains our interpretation of the pattern; every count on this page is a measurement. We publish no verdict on operations at Sanford; the operating picture belongs to the airport, the airlines and the FAA. What would reopen this page. A weekday count at SFB with the training fleet below its 277–348 band under VFR weather on a normal collection day, with a corroborating signal in any layer, or a closure event or closure notice for the Jacksonville FIR or the aerodrome. Neither appeared while this page was open.
Passenger questions, answered from the data
We publish observed movement counts, not flight status. In our count, scheduled airline movements at Sanford were not reduced on 6–7 October — the based low-cost carrier logged 43 movements on 7 October, more than on any of the four previous Wednesdays. The 71% drop sits in local training sorties and private flying, under low cloud and heavy rain. For a specific flight, check your airline or the airport's own channels.
On 7 October our receivers observed 130 movements at SFB, 63% below its 348 seven-day average and 71% below the ~452 mean of its four previous Wednesdays. About two-thirds of Sanford's normal observed traffic is one fleet flying short sorties that mostly return to Sanford — a flight-training pattern. That fleet logged 49 movements against a ~307 Wednesday mean (−84%) on a day when the airport reported IFR or lower in 11 of 16 weather observations. The day settled at 132 on 11 October, and the counts recovered with the weather: 493 movements on Friday 9 October with the fleet at 327, 366 on Sunday 11 October and 656 on Monday 12 October. Observed counts are a floor, not a total.
Not in our data. Orlando International logged 883 observed movements on 7 October against 792 on the previous Wednesday, despite 7 IFR and 8 marginal-VFR weather reports that day. Tampa (524 vs 473) and Jacksonville (263 vs 253) were ordinary too. The drop is at airports dominated by training and private flying.
Not in our data. By the National Hurricane Center's positions, Isaias came closest to Sanford at about 535 km — on the Florida panhandle coast around 01:00 UTC on 10 October, as a 90-knot hurricane — and was classed post-tropical from 06:00 UTC that day; the last advisory was issued at 15:00 UTC on 11 October. No closure event, restriction or traffic anomaly tied to the storm appeared in the Jacksonville FIR, and Sanford's observed counts on 9–12 October were at or above their same-weekday norms (the thunderstorm Saturday, 10 October, read −9%). We do not forecast storm tracks or airport operations; for operating decisions, your airline and the airport are the source.
We publish measured signals, not safety verdicts — operating decisions belong to airlines, airports and the FAA, who work from their own complete data. What our layers showed: no closure event for the Jacksonville FIR, no restriction over Sanford, no GNSS-interference signature, no ash exposure, airline movements not reduced, a sharp drop in training and private flying during a spell of low cloud and heavy rain — and, from 9 October, counts back at or above their same-weekday norms.
For media — the full kit
Everything on this page — charts, CSV, quotes — is published under CC BY 4.0: free to reuse with attribution to FlySafe.zone. Charts come in dark (social/web) and light (print/light layouts) versions; attribution and license are embedded in every file.
“Observed traffic at Orlando Sanford International fell to 130 movements on Wednesday 7 October — 71% below recent Wednesdays — but scheduled airline movements were not reduced: the shortfall sits almost entirely in local training sorties, down 84% as the airport reported IFR cloud in 11 of 16 weather observations, while Orlando International, Tampa and Jacksonville traffic was ordinary, according to flight-monitoring service FlySafe.zone.”
Boilerplate — about the source (for your article footer)
FlySafe.zone monitors airspace risk and observed airport activity worldwide: 334 flight-information regions scored daily, GPS-interference signals, volcanic-ash exposure and daily observed movements at 493 airports from the crowdsourced ADS-B receiver network. Methodology: flysafe.zone/methodology.
Need a different cut of the data, a comment, or numbers for another airport? Leave an email — we answer fast during active events.