Hurricane Isaias — Gulf of Mexico approach and Pensacola's exposure, October 2026
- Isaias has come ashore and weakened. NHC positions put the centre on the Florida Panhandle coast near 30.4 N, 86.5 W at 01:30 UTC on 10 October at 90 kt, down from a 105 kt peak on 9 October. By 15:00 UTC it was a 30 kt post-tropical low over central Alabama, and on 11 October a 20 kt remnant over eastern Kentucky.
- Closest approach: Pensacola (PNS) about 66 km from the centre at 01:30 UTC, New Orleans (MSY) 325 km, Tampa (TPA) 454 km. Pensacola's observations peaked at a gust of 80 kt at 23:46 UTC on 9 October; New Orleans peaked at 33 kt and Tampa at 23 kt.
- The storm-tied SIGMETs have lapsed. The last tropical-cyclone SIGMET for the Houston and Miami Oceanic FIRs ran to 21:15 UTC on 9 October; the last of 28 convective SIGMETs tied to Isaias expired at 09:55 UTC on 10 October.
- Pensacola's traffic collapsed on landfall day and the approach day before it. It read 54 movements on 9 October (−79%, flight records, none logged after 15:28 UTC) and 0 movements on 10 October (−100%), the day the centre crossed the coast 66 km to the east, after 226 (−13%) on 8 October. 11 October read 6 (−98%), with the first airline flights since the storm logged from 12:43 UTC, and 12 October 22 (−92%). 13 October read 151 (−42%): the normal daytime shape is back, with 63 airline-flight-number movements against 87–94 before the storm — recovery under way. 14 October read 384 (+47%), the airport's highest day in the 60 days we hold, with 95 airline-flight-number movements, level with the pre-storm count, and 15 October 369 (+41%). 16 October settled at 301 (+15%), back inside the airport's own September range. 17 October settled at 158 (−39%), a Saturday, with 99 airline-flight-number movements — above the pre-storm 87–94 — and the drop in local flying. 18 October settled at 238 (−9%), a Sunday, with 83 airline-flight-number movements — just below the pre-storm 87–94 — inside the airport's own September Sunday range. 19 October settled at 317 (+21%), a Monday, and 20 October at 359 (+38%), a Tuesday, with 91 airline-flight-number movements inside the pre-storm range and the surplus in private and local flying; 21 October settled at 360 (+38%), a Wednesday, with 87 airline-flight-number movements and the same pattern; 22 October settled at 381 (+46%), a Thursday, the second-highest day in the 60 days we hold, with 92, 23 October settled at 343 (+31%), a Friday, with 89, and 24 October settled at 298 (+14%), a Saturday, with 95. 25 October settled at 263 (+1%), a Sunday, with 97 — within one per cent of the reference and inside the airport's own September Sunday range. 26 October settled at 312 (+20%), a Monday, with 91 and the surplus in private and local flying, 27 October at 355 (+36%), a Tuesday, with 98, 28 October at 335 (+28%), a Wednesday, with 92, and 29 October at 373 (+43%), a Thursday, the third-highest day in the 60 days we hold, with 90 and the same pattern; 30 October read 287 (+10%), a Friday, with 92, inside the airport's own September Friday range. 31 October settled at 237 (−9%), a Saturday, with 87, inside the airport's own September Saturday range — the first day below the reference since 18 October. 1 November settled at 99 (−62%), a Sunday, with 61, and 2 November at 158 (−39%), a Monday, with 72 — both below the airport's own September range for the weekday, on two days when the feed reads thin at US airports of Pensacola's size; 3 November read 149 (−43%), a Tuesday, with 68, and 4 November settled at 141 (−46%), a Wednesday, with 81, both below the airport's own September range for the weekday while the neighbouring airports read far closer to normal. None of the four is attributed to the storm. 5 November settled at 213 (−18%), a Thursday, with 86 — back inside the airport's own September Thursday range. 6 November settled at 358 (+37%), a Friday, and 7 November settled at 324 (+24%), a Saturday — both above the airport's own September range for the weekday, with 84 under airline flight numbers; 8 November settled at 355 (+36%), a Sunday — the highest Sunday in the window; 9 November reads 335 (+28%), a Monday, final without its third pass — the highest Monday in the window. The surplus is in private and local flying, not attributed.
- Hurricane disruption is front-loaded and recovery depends on airfield inspections and aircraft repositioning. Check your airline's status on the day of travel; airport and airspace closures are published through the FAA's NOTAM system.
Advisory timeline — how active is this episode
Isaias began as a 30 kt tropical depression at 21:00 UTC on 6 October near 22.1 N, 95.6 W, in the south-western Gulf of Mexico, about 1,250 km from Pensacola. It drifted east, became a tropical storm by 09:00 UTC on 7 October, reached hurricane strength (65 kt) at 03:30 UTC on 8 October, and turned steadily to the right — east-northeast, northeast, then north-northeast — speeding up from 5 kt to 15–19 kt. It peaked at 105 kt, Category-3-equivalent, from 12:20 to 20:00 UTC on 9 October, with central pressure down to 958–959 mb, then eased on the run-in to the coast: 100 kt at 21:00 UTC, 95 kt at 00:00 UTC and 90 kt at 01:30 UTC on 10 October, when NHC positions put the centre on the Florida Panhandle coast near 30.4 N, 86.5 W, between Fort Walton Beach and Destin. Inland it weakened fast — 80 kt at 03:00 UTC, post-tropical at 55 kt by 06:00 UTC and 30 kt by 09:00 UTC; at 15:00 UTC it was near 32.8 N, 86.8 W over central Alabama, 1006 mb, moving north-northwest at 10 kt. The remnant then turned north-east and sped up: 20 kt by 03:00 UTC on 11 October, and at 15:00 UTC near 37.5 N, 84.0 W over eastern Kentucky, 1010 mb, moving east-northeast at 22 kt. 42 advisories and updates, including intermediate ones, have been issued; the 15:00 UTC advisory on 11 October is the last in our feed, and none has followed as of 13 November; the feed's most recent advisory, for another storm, is from 15:00 UTC on 12 November. Daily peak intensity across the advisory track (10 October's 95 kt peak is the 00:00 UTC reading, before the centre reached the coast; 11 October's 20 kt is that last advisory):
Fig. 1 — Hurricane Isaias daily peak intensity (kt), NHC public advisories · Data as of 13 Nov 2026, 12:50 UTC · Source: NHC public advisories (storm al092026).
Airports in the exposure zone
| Airport | Size | Closest approach of the centre, 9–10 Oct (NHC positions) | FIR |
|---|---|---|---|
| Pensacola International (PNS) | medium | 66 km · centre passed to the east at 01:30 UTC 10 Oct · METAR peak gust 80 kt · traffic 9 Oct 54 movements, −79% · 10 Oct 0, −100% · 11 Oct 6, −98% · 12 Oct 22, −92% · 13 Oct 151, −42%, recovery under way · 14 Oct 384, +47%, highest day in 60 days · 15 Oct 369, +41% · 16 Oct 301, +15%, inside its own September range · 17 Oct 158, −39%, airline count above pre-storm · 18 Oct 238, −9%, Sunday, airline count just below pre-storm · 19 Oct 317, +21%, Monday · 20 Oct 359, +38%, Tuesday · 21 Oct 360, +38%, Wednesday · 22 Oct 381, +46%, Thursday, second-highest day in 60 days · 23 Oct 343, +31%, Friday · 24 Oct 298, +14%, Saturday · 25 Oct 263, +1%, Sunday, at the reference · 26 Oct 312, +20%, Monday · 27 Oct 355, +36%, Tuesday · 28 Oct 335, +28%, Wednesday · 29 Oct 373, +43%, Thursday, third-highest day in 60 days · 30 Oct 287, +10%, Friday, inside its own September range · 31 Oct 237, −9%, Saturday, inside its own September range · 1 Nov 99, −62%, Sunday, thin feed day, not attributed · 2 Nov 158, −39%, Monday, thin feed day, not attributed · 3 Nov 149, −43%, Tuesday, not attributed · 4 Nov 141, −46%, Wednesday, not attributed · 5 Nov 213, −18%, Thursday, inside its own September range · 6 Nov 358, +37%, Friday, seventh-highest day in 60 days · 7 Nov 324, +24%, Saturday · 8 Nov 355, +36%, Sunday · 9 Nov 335, +28%, Monday | KZJX |
| Louis Armstrong New Orleans International (MSY) | large | 325 km · west of the track · METAR peak gust 33 kt · traffic at usual level through 30 Oct (10 Oct 320, 11 Oct 312, 12 Oct 357, 13 Oct 361, 14 Oct 332, 15 Oct 341, 16 Oct 363, 17 Oct 314, 18 Oct 326, 19 Oct 339, 20 Oct 328, 21 Oct 318, 22 Oct 344, 23 Oct 356, 24 Oct 295, 25 Oct 311, 26 Oct 341, 27 Oct 355, 28 Oct 322, 29 Oct 330, 30 Oct 365; 31 Oct 287, 1 Nov 244 and 2 Nov 338, on thinner feed days; 3 Nov 310 and 4 Nov 288; 5 Nov 350 and 6 Nov 371; 7 Nov 222; 8 Nov 286; 9 Nov 336) | KZHU |
| Tampa International (TPA) | large | 454 km · east of the track · METAR peak gust 23 kt · traffic at usual level through 30 Oct (10 Oct 560, 11 Oct 511, 12 Oct 606, 13 Oct 572, 14 Oct 534, 15 Oct 573, 16 Oct 614, 17 Oct 556, 18 Oct 546, 19 Oct 557, 20 Oct 590, 21 Oct 544, 22 Oct 601, 23 Oct 609, 24 Oct 539, 25 Oct 569, 26 Oct 605, 27 Oct 600, 28 Oct 553, 29 Oct 605, 30 Oct 617; 31 Oct 517, 1 Nov 508 and 2 Nov 590, on thinner feed days; 3 Nov 594 and 4 Nov 570; 5 Nov 603 and 6 Nov 600; 7 Nov 583; 8 Nov 559; 9 Nov 609) | KZJX |
Distance alone does not determine impact — wind direction and the flight levels the ash reaches decide which airports and routes are affected on a given day. FIR = Flight Information Region.
What our monitoring shows: Pensacola read 54 movements on 9 October (−79%), the approach day, 0 on 10 October (−100%), the day the storm centre crossed the coast 66 km to the east, 6 on 11 October (−98%) and 22 on 12 October (−92%); 13 October read 151 (−42%), with the airport's normal daytime shape back from 13:00 UTC — recovery under way, inside the airport's own early-October range; 14 October settled at 384 (+47%), the airport's highest day in the 60 days we hold, with 95 movements under airline flight numbers against 87–94 before the storm, and 15 October settled at 369 (+41%), now the fourth-highest; 16 October has settled at 301 (+15%), back inside the range of the airport's own September reference days; 17 October has settled at 158 (−39%), a Saturday, with 99 movements under airline flight numbers — above the pre-storm 87–94 — and the drop from the two surplus days entirely in private and local flying; 18 October has settled at 238 (−9%), a Sunday, with 83 movements under airline flight numbers — just below the pre-storm 87–94 — and inside the airport's own September Sunday range; 19 October has settled at 317 (+21%), a Monday, with 86 under airline flight numbers and the private and local flying again above its usual level; 20 October has settled at 359 (+38%), a Tuesday, with 91 under airline flight numbers, inside the pre-storm 87–94; 21 October has settled at 360 (+38%), a Wednesday, now the fifth-highest day in the 60 days we hold, with 87 under airline flight numbers, again inside that range; 22 October has settled at 381 (+46%), a Thursday, the second-highest, with 92 under airline flight numbers, inside that range too; 23 October has settled at 343 (+31%), a Friday, with 89 under airline flight numbers, also inside that range; 24 October has settled at 298 (+14%), a Saturday, with 95 under airline flight numbers, just above that range; 25 October has settled at 263 (+1%), a Sunday, within one per cent of the reference and inside the airport's own September Sunday range, with 97 under airline flight numbers; 26 October has settled at 312 (+20%), a Monday, above the reference again, with 91 under airline flight numbers and the surplus in private and local flying; 27 October has settled at 355 (+36%), a Tuesday, with 98 under airline flight numbers, above that range, and the surplus again in private and local flying; 28 October has settled at 335 (+28%), a Wednesday, with 92 under airline flight numbers, inside that range; 29 October has settled at 373 (+43%), a Thursday, the third-highest day in the 60 days we hold, with 90 under airline flight numbers, inside that range too, and the surplus again in private and local flying; 30 October reads 287 (+10%), a Friday, with 92 under airline flight numbers, inside that range, and inside the airport's own September Friday range; 31 October has settled at 237 (−9%), a Saturday, the first day below the reference since 18 October, with 87 under airline flight numbers, at the bottom of that range, and inside the airport's own September Saturday range; 1 November has settled at 99 (−62%), a Sunday, with 61 under airline flight numbers, and 2 November at 158 (−39%), a Monday, with 72, both below that range and below the airport's own September range for the weekday, on two thin feed days; 3 November reads 149 (−43%), a Tuesday, with 68, and 4 November has settled at 141 (−46%), a Wednesday, with 81, both below that range and the airport's own September range for the weekday on days when the feed and the neighbouring airports read far closer to normal — none of the four attributed to the storm; 5 November has settled at 213 (−18%), a Thursday, with 86 under airline flight numbers, just below that range, and back inside the airport's own September Thursday range; 6 November has settled at 358 (+37%), a Friday, the seventh-highest day in the 60 days we hold, and 7 November has settled at 324 (+24%), a Saturday — both above the airport's own September range for the weekday, with 84 under airline flight numbers; 8 November has settled at 355 (+36%), a Sunday — the highest Sunday in the window, with 90 under airline flight numbers; 9 November reads 335 (+28%), a Monday, final without its third pass — the highest Monday in the window, with 83 under airline flight numbers; the surplus on all four days is in private and local flying, which we do not attribute
FlySafe tracks observed departures and arrivals at 493 airports from crowdsourced ADS-B receiver data. Observed counts are a floor, not a total — receiver coverage varies — but an airport measured against its own baseline is a reliable shape. Pensacola International's last 30 days:
Fig. 2 — Observed daily movements at PNS, 10 Sept – 9 Nov (latest complete UTC day). Data as of 13 Nov 2026, 12:50 UTC · Source: FlySafe monitoring (ADS-B receiver network).
- Reference level: ~261 ADS-B-observed movements/day at Pensacola (PNS) — the mean of the 23 settled days from 8 to 30 September. The plain mean of the window drawn above (10 September–9 November) is 244; we quote against ~261 instead because the window holds a six-day low run that has nothing to do with this storm (next point) and the thirty-two days since the storm arrived, and folding them in would make the airport's normal level look lower than it is. A coverage floor, not an official total.
- The 1–6 October dip predates Isaias. Pensacola read 180, 131, 122, 111, 139 and 171 on 1–6 October (−31% to −57%). The storm did not exist until 21:00 UTC on 6 October, and then about 1,250 km away in the south-western Gulf, so we attribute none of that run to it. It is not a hole in our collection either: feed-wide, 1–5 October hold 93–104% of a normal recent day. Mobile (MOB) read low on 2–4 October as well (21, 22, 13 against 43 on each of 29 September–1 October), while New Orleans (MSY) and Birmingham (BHM) held their usual levels. Distinct departing callsigns at Pensacola fell less than departures did (from 95–98 a day to 57–79), so it was mostly repeat local flying that dropped out. From this feed alone we cannot tell whether that was fewer flights or thinner low-level receiver coverage, and we do not guess. It is also why the 7-day average that first flagged this airport, 158, sits well below the reference.
- 6 and 7 October have settled at 171 and 282 (+8%): the daily rollup now matches the flight records we plotted on earlier updates.
- 8 October has settled at 226 (132 departures, 94 arrivals), −13% against ~261 — three up on the 223 we first published as late records arrived. The daily rollup now matches the flight records exactly, and the collection-gap flag the PNS airport page carried for this day on 11–12 October has cleared; as we said at the time, that flag was our own refresh overwriting the day with a partial count, not a hole in the records. We do not attribute the shortfall to Isaias: the centre was still at least 640 km away over the central Gulf all day, and 226 sits inside the airport's own range — four of the 23 reference days read lower (151–206).
- 9 October — the day the storm arrived — read 54 (32 departures, 22 arrivals), −79% against ~261. Rollup and flight records agree — the rollup, which a refresh on 12 October had briefly overwritten with a partial count of 1, was restored to 54 by the nightly refresh on 13 October — and feed-wide it is a whole day (about 261,400 movements worldwide, with the normal hour-by-hour shape). 31 of the 54 movements fall before 06:00 UTC — the evening of 8 October in local time — and the last one logged is at 15:28 UTC; nothing follows for the rest of the day, the hours in which Pensacola's gusts rose from 29 kt to 80 kt. Movements under airline-style flight numbers fell to 39, against 87–94 a day on 5–8 October. Away from the coast, New Orleans, Birmingham and Tampa kept their usual afternoon traffic. This is the first effect on this page we attribute to Isaias: it falls on a day the storm was close enough to matter and goes far deeper than the airport's own early-October low run (lowest day 111). ADS-B alone cannot separate flights that stopped from local receivers that may have lost power in the storm, so we report the drop, not its split. Settled: the figure has not moved since we first published it on 10 October.
- 10 October — the day the centre crossed the coast — reads 0. Our flight records hold no movement at Pensacola at all that day — no departure, no arrival — and the daily rollup has no row for the airport; a second, thinner receiver network logs 1 departure and 0 arrivals. Feed-wide, 10 October is a whole day in the flight records: about 135,300 departures from about 5,800 airports, 86% of the 7–9 October level, and Mobile, New Orleans and Tampa read their usual levels (40, 320 and 560 movements). So the zero is Pensacola's, not a hole in our collection, and it is consistent with the airport being directly in the 90 kt wind field from shortly after 01:30 UTC. −100% against the ~261/day reference. One note on our own flags: on 14 October the PNS airport page briefly marked 10 October as a collection gap, because an 18:25 UTC refresh on 13 October had overwritten that day's rollup, feed-wide, with a partial count (about 28,700 movements worldwide) and the gap test runs on the rollup, not on the flight records; the nightly refresh on 14 October restored the rollup (about 222,000 movements worldwide) and the flag has cleared, as it did for 8 and 9 October. Pensacola's own figure for the day is unchanged at 0. Birmingham (BHM), some 85 km north of where the 30 kt post-tropical low was placed at 15:00 UTC, read 119 that day against 233–306 on the five preceding weekdays; 10 October was a Saturday, and we have not run this page's attribution test on Birmingham, so we note it without attributing it.
- 11 October — the first full day after landfall — reads 6 (1 departure, 5 arrivals), −98% against ~261; the daily rollup and the flight records agree. The records list a private aircraft arriving from New Orleans at 06:19 UTC, then the first airline movements logged at Pensacola since 15:28 UTC on 9 October: a departure to Atlanta at 12:43 UTC and arrivals from Charlotte, Nashville and Washington between 13:26 and 14:41 UTC, and a NOAA aircraft at 22:13 UTC — four of the six under airline-style flight numbers, against 87–94 a day on 5–8 October. Away from the coast, New Orleans read 312, Birmingham 250 and Tampa 511 once late records had arrived, at or near their 5–9 October levels on a Sunday. Feed-wide the day holds about 123,600 departures, 78% of the 7–9 October level, so it is in the feed, if a little thin. This day meets both of this page's tests and we attribute it to the storm, with the same split caveat as 9 October: a receiver network cannot tell flights that did not operate from receivers that were still down. Settled: the feed's third nightly pass for the day, at 02:34 UTC on 14 October, added no Pensacola record, and the daily rollup was re-run at 02:35 UTC on 15 October at the same 6.
- 12 October — the second day after landfall — reads 22 (14 departures, 8 arrivals), −92% against ~261; 12 of the 22 are under airline-style flight numbers, against 87–94 a day on 5–8 October. The flight records are now whole for the day: the feed's nightly pass at 02:30 UTC on 14 October brought in the bulk of 12 October — feed-wide about 91% of 9 October's departure count, with the normal hour-by-hour shape — and the third pass on 15 October added no Pensacola record. We plot the flight-record count; the daily rollup briefly stored 20, because the 03:25 UTC refresh on 15 October re-counted the day from 03:25 UTC onward and dropped an arrival at 00:22 and a departure at 03:12; a later nightly refresh restored it to 22. The day's shape is worth stating plainly: a departure to Houston at 03:12 UTC, then a run of airline departures from 10:29 UTC — Charlotte, Houston, Atlanta, Washington, Dallas, Nashville, Atlanta again, Orlando — with arrivals from Tampa, Atlanta, Tallahassee and smaller fields between 12:24 and 13:17 UTC, and the last movement logged at 13:55 UTC; nothing follows for the rest of the day, while New Orleans, Birmingham and Tampa read 357, 283 and 606. The second, thinner receiver network logs 28 movements at Pensacola that day (19 departures, 9 arrivals) — more than our main feed's 22 — which points to receiver coverage at the airport, not flights alone, being part of that afternoon silence; from these feeds we cannot split it, and we do not guess. The day meets both of this page's tests — two days after landfall, far below the airport's own early-October low of 111 — and we attribute it to the storm with that caveat attached.
- 13 October reads 151 (72 departures, 79 arrivals), −42% against ~261, with the daily rollup and the flight records in agreement. The hour-by-hour shape is the airport's normal one again: 2 movements in the 01:00 UTC hour (the evening of 12 October locally), 1 at 11:00, then 8, 10, 16, 20, 20, 18, 18 and 15 an hour from 13:00 to 20:59 UTC, tailing off to 6 in the last hour. 63 of the 151 are under airline-style flight numbers, against 87–94 a day on 5–8 October; the second receiver network logs 30. New Orleans, Birmingham and Tampa read 361, 303 and 572 once late records had arrived. Feed-wide the day is whole — about 93% of 9 October's departure count, with the normal hour-by-hour shape. Settled: the feed's third nightly pass for 13 October, at 02:32 UTC on 16 October, added no Pensacola record. We plot the flight-record count; the daily rollup briefly stored 149, because the 03:25 UTC refresh on 16 October re-counted the day from 03:25 UTC onward and dropped the two departures in the 01:00 UTC hour; a later nightly refresh restored it to 151. On this page's rule, this day passes the first test but not the second: 151 is three days after landfall, but it sits inside the range the airport posted on its own on 1–6 October (111–180), so we do not attribute the remaining shortfall to the storm. We do not claim it is unrelated either; we report it as recovery under way and will say where the airport settles once the following days are in.
- 14 October has settled at 384 (196 departures, 188 arrivals), +47% against ~261 — the airport's highest day in the 60 days we hold (the high before this week was 320 on 15 September), one up on the 383 we first published: the feed's third nightly pass for the day, at about 02:30 UTC on 17 October, added one late-evening arrival. We plot the flight-record count; the daily rollup briefly stored 337, because the 12:25 UTC refresh on 17 October re-counted the day from 12:25 UTC onward and dropped the movements before then; a later nightly refresh restored it to 384. The hour-by-hour shape is the normal one, fuller: 27, 24, 29, 35, 35, 33, 38, 30, 26 and 37 an hour from 12:00 to 21:59 UTC. 95 of the 384 are under airline-style flight numbers — level with the 87–94 a day of 5–8 October, so the airline count is back at its pre-storm level — and the rest is the private and local flying that had dropped out in early October, now above its usual level: 136 distinct departing callsigns against 95–98 on a reference day, and 45 flights with both ends at Pensacola, which account for 90 of the 384 movements. Feed-wide the day is whole — about 94% of 9 October's departure count, with the normal hour-by-hour shape — and New Orleans, Birmingham, Tampa and Mobile read 332, 363, 534 and 42 once late records had arrived, their usual levels. The second, thinner receiver network logs 17 movements at Pensacola that day, far below our main feed's 384, so the coverage caveat we attached to 12 October does not apply here. This page's tests are built for shortfalls, and 384 is a surplus: we do not attribute it to the storm, and whether it is aircraft returning after four days away or something else, this feed alone cannot say, so we report it and do not guess.
- 15 October has settled at 369 (187 departures, 182 arrivals), +41% against ~261 — now the fourth-highest day in the 60 days we hold, after 14 October (384), 22 October (381) and 29 October (373). The feed's second nightly pass for the day landed at about 02:30 UTC on 17 October, and feed-wide the day is whole: about 94% of 9 October's departure count, with the normal hour-by-hour shape. At Pensacola the shape is the normal one, fuller: 28, 25, 39, 31, 30, 31, 29, 37, 31 and 24 an hour from 12:00 to 21:59 UTC. 85 of the 369 are under airline-style flight numbers, just under the 87–94 a day of 5–8 October; the surplus is again private and local flying — 123 distinct departing callsigns against 95–98 on a reference day, and 48 flights with both ends at Pensacola, 96 of the 369 movements. New Orleans, Birmingham, Tampa and Mobile read 341, 290, 573 and 48 once late records had arrived, their usual levels; the second receiver network logs 15 at Pensacola. Settled: the feed's third nightly pass for 15 October, at about 02:30 UTC on 18 October, added no Pensacola record. We plot the flight-record count; the daily rollup briefly stored 231, because the 15:25 UTC refresh on 18 October re-counted the day from 15:25 UTC onward and dropped the movements before then — the same partial re-count we described for 14 October — which is why the PNS airport page marked 15 October as a collection gap for a few days; a later nightly refresh restored the rollup to 369 and the flag has cleared. The flight records for the day were whole throughout. A second surplus day in a row, and as with 14 October we do not attribute it to the storm and do not guess at its cause.
- 16 October has settled at 301 (146 departures, 155 arrivals), +15% against ~261. The feed's third nightly pass for the day landed at about 02:30 UTC on 19 October and added four movements — two departures and two arrivals — to the 297 we published on the previous update; feed-wide the day is whole. At Pensacola the shape is the normal one: 26, 22, 36, 23, 31, 31, 29, 23, 10 and 9 an hour from 12:00 to 21:59 UTC (unchanged from the second pass). 89 of the 301 are under airline-style flight numbers, just at the 87–94 a day of 5–8 October; the private and local flying has come down from the two days before — 109 distinct departing callsigns, against 123–136 on 14–15 October and 95–98 on a reference day. 301 sits above the ~261 reference, but inside the range the airport posted on its own on the 23 reference days (the highest of them 320, on 15 September), so we read it as the airport moving back towards its usual level, not as a third surplus day. New Orleans, Birmingham, Tampa and Mobile read 363, 279, 614 and 51, their usual levels. Settled: the third pass added four movements, none changing the narrative.
- 17 October has settled at 158 (79 departures, 79 arrivals), −39% against ~261 — a Saturday, and the first day below the reference since 13 October. The feed's third nightly pass for the day landed at about 02:30 UTC on 20 October and added four movements to the 154 we published on the previous update; feed-wide the day holds about 132,500 departures from about 5,970 airports, 84% of the 9 October level, with the normal hour-by-hour shape. 99 of the 158 are under airline-style flight numbers — above the 87–94 a day of 5–8 October — so the airline count is not only back at its pre-storm level but slightly above it; the drop from the two surplus days is entirely in private and local flying: 76 distinct departing callsigns, against 109–136 on 14–16 October and 95–98 on a reference day, and 5 flights with both ends at Pensacola, 10 of the 158 movements. New Orleans, Birmingham, Tampa and Mobile read 314, 222, 556 and 43, their usual Saturday levels. Settled: the third pass added four movements, none changing the narrative.
- 18 October has settled at 238 (123 departures, 115 arrivals), −9% against ~261 — a Sunday, two up on the 236 we published on the previous update: the feed's third nightly pass for the day, at about 02:30 UTC on 21 October, added one departure and one arrival, both in the 23:00 UTC hour. Feed-wide the day is whole — about 145,300 departures from about 6,390 airports, 92% of the 9 October level, with the normal hour-by-hour shape. At Pensacola the shape is the normal one: 3, 5, 3, 3, 2 an hour from 00:00 to 04:59 UTC, then 1, 1, 1, 1, 5, 20, 13, 19, 21, 23, 21, 18, 11, 23, 21, 16, 7 from 07:00 to 23:59 UTC. 83 of the 238 are under airline-style flight numbers — just below the 87–94 a day of 5–8 October — with 88 distinct departing callsigns and 17 flights with both ends at Pensacola, 34 of the 238 movements. New Orleans, Birmingham, Tampa and Mobile read 326, 254, 546 and 27 once late records had arrived, their usual Sunday levels. 238 sits below the ~261 reference but inside the range of the airport's own September Sundays (231–292): on the previous update we wrote that it sat well below that range, quoting 253–303, which are the airport's September Mondays, not its Sundays — corrected here. Eight days after landfall, and under this page's rule we do not attribute it. Settled: the daily rollup, re-run at 02:34 UTC on 22 October, stores the same 238.
- 19 October has settled at 317 (157 departures, 160 arrivals), +21% against ~261 — a Monday, and the first day above the reference since 16 October. All three of the feed's nightly passes for the day are in — the bulk at about 02:30 UTC on 21 October, the third at about 02:30 UTC on 22 October, adding three movements — and feed-wide the day is whole: about 153,800 departures from about 6,600 airports, 98% of the 9 October level, with the normal hour-by-hour shape. At Pensacola the shape is the normal one, fuller: 7, 9, 8, 5, 8 an hour from 00:00 to 04:59 UTC, then 25, 13, 22, 24, 25, 28, 22, 27, 24 and 27 from 12:00 to 21:59 UTC. 86 of the 317 are under airline-style flight numbers, just under the 87–94 a day of 5–8 October; the surplus is private and local flying again — 108 distinct departing callsigns against 95–98 on a reference day, and 29 flights with both ends at Pensacola, 58 of the 317 movements. New Orleans, Birmingham, Tampa and Mobile read 339, 256, 557 and 45, their usual levels. 317 sits above each of the airport's three September Mondays (253–303) but below the two surplus days of 14–15 October. We plot the flight-record count; the daily rollup briefly stored 292, because the 03:25 UTC refresh on 22 October re-counted the day from 03:25 UTC onward and dropped the 25 movements before then — the same partial re-count we described for 14 and 15 October; the nightly refresh at about 02:30 UTC on 23 October restored it to 317. Nine days after landfall; a surplus is outside what this page's tests are built to attribute, and we do not.
- 20 October has settled at 359 (178 departures, 181 arrivals), +38% against ~261 — a Tuesday, four up on the 355 we published on the previous update: the feed's third nightly pass for the day, at about 02:30 UTC on 23 October, added two departures and two arrivals, all in the 23:00 UTC hour. It is now the sixth-highest day in the 60 days we hold, after 14 October (384), 22 October (381), 29 October (373), 15 October (369) and 21 October (360), and sits above each of the airport's four September Tuesdays (206–320; the September high was 320, on 15 September). Feed-wide the day holds about 154,500 departures from about 6,700 airports, 98% of the 9 October level. At Pensacola the shape is the normal one, fuller: 25, 22, 23, 34, 28, 31, 21, 22, 33 and 28 an hour from 12:00 to 21:59 UTC (unchanged from the second pass). 91 of the 359 are under airline-style flight numbers — inside the 87–94 a day of 5–8 October — and the rest is private and local flying above its usual level: 120 distinct departing callsigns against 95–98 on a reference day, and 37 flights with both ends at Pensacola, 74 of the 359 movements. New Orleans, Birmingham, Tampa and Mobile read 328, 301, 590 and 56, their usual levels. We plot the flight-record count; the daily rollup briefly stored 322, because the 06:25 UTC refresh on 23 October re-counted the day from 06:25 UTC onward and dropped the 37 movements before then — the same partial re-count we described for 19 October; a later refresh restored it to 359. As with 14 and 15 October, a surplus is outside what this page's tests are built to attribute: we report it and do not guess at its cause. Settled: the third pass added four movements, none changing the narrative.
- 21 October has settled at 360 (184 departures, 176 arrivals), +38% against ~261 — a Wednesday, four up on the 356 we published on the previous update: the feed's third nightly pass for the day, at about 02:30 UTC on 24 October, added three departures and one arrival, all in the 22:00 and 23:00 UTC hours. It is now the fifth-highest day in the 60 days we hold, one above 20 October, and sits above each of the airport's four September Wednesdays (244–295). Feed-wide the day holds about 151,600 departures from about 6,660 airports, 96% of the 9 October level. At Pensacola the shape is the normal one, fuller: 13, 7, 6, 3 and 3 an hour from 00:00 to 04:59 UTC, then 20, 16, 27, 23, 31, 42, 30, 38, 23 and 29 from 12:00 to 21:59 UTC (unchanged from the second pass). 87 of the 360 are under airline-style flight numbers — inside the 87–94 a day of 5–8 October, at its lower end — and the rest is private and local flying above its usual level: 124 distinct departing callsigns against 95–98 on a reference day, and 39 flights with both ends at Pensacola, 78 of the 360 movements. New Orleans, Birmingham, Tampa and Mobile read 318, 291, 544 and 58, their usual levels. We plot the flight-record count; the daily rollup briefly stored 326, because the 09:25 UTC refresh on 24 October re-counted the day from 09:25 UTC onward and dropped the 34 movements before then — the same partial re-count we described for 19 and 20 October; the nightly refresh at about 02:30 UTC on 25 October restored it to 360. As with 19 and 20 October, a surplus is outside what this page's tests are built to attribute: we report it and do not guess at its cause. Settled: the third pass added four movements, none changing the narrative.
- 22 October has settled at 381 (195 departures, 186 arrivals), +46% against ~261 — a Thursday, four up on the 377 we published on the previous update: the feed's third nightly pass for the day, at about 02:30 UTC on 25 October, added two departures and two arrivals. It is the second-highest day in the 60 days we hold, three under 14 October (384), and sits above each of the airport's three September Thursdays (171–308). Feed-wide the day holds about 158,000 departures from about 6,810 airports, level with the 9 October count. At Pensacola the shape is the normal one, fuller: 11, 8, 8, 3 and 5 an hour from 00:00 to 04:59 UTC, then 25, 24, 26, 26, 41, 28, 35, 26, 32 and 29 from 12:00 to 21:59 UTC (unchanged from the second pass). 92 of the 381 are under airline-style flight numbers — inside the 87–94 a day of 5–8 October — and the rest is private and local flying above its usual level: 120 distinct departing callsigns against 95–98 on a reference day, and 47 flights with both ends at Pensacola, 94 of the 381 movements. New Orleans, Birmingham, Tampa and Mobile read 344, 279, 601 and 61 once late records had arrived, their usual levels. We plot the flight-record count; the daily rollup briefly stored 320, because the 12:25 UTC refresh on 25 October re-counted the day from 12:25 UTC onward and dropped the 61 movements before then — the same partial re-count we described for 19–21 October; the nightly refresh at about 02:30 UTC on 26 October restored it to 381. As with 19–21 October, a surplus is outside what this page's tests are built to attribute: we report it and do not guess at its cause. Settled: the third pass added four movements, none changing the narrative.
- 23 October has settled at 343 (171 departures, 172 arrivals), +31% against ~261 — a Friday, the fifth day in a row above the reference, six up on the 337 we published on the previous update: the feed's third nightly pass for the day, at about 02:30 UTC on 26 October, added two departures and four arrivals, all after 22:30 UTC. It is now the tenth-highest day in the 60 days we hold, after 14 October (384), 22 October (381), 29 October (373), 15 October (369), 21 October (360), 20 October (359), 6 November (358), 27 October (355) and 8 November (355), and sits above each of the airport's three September Fridays (151–319). Feed-wide the day holds about 157,300 departures from about 6,640 airports, level with the 9 October count. At Pensacola the shape is the normal one, fuller: 8, 9, 12, 4 and 7 an hour from 00:00 to 04:59 UTC, then 30, 21, 26, 27, 26, 30, 29, 28, 19 and 28 from 12:00 to 21:59 UTC (unchanged from the second pass). 89 of the 343 are under airline-style flight numbers — inside the 87–94 a day of 5–8 October — and the rest is private and local flying above its usual level: 114 distinct departing callsigns against 95–98 on a reference day, and 39 flights with both ends at Pensacola, 78 of the 343 movements. New Orleans, Birmingham, Tampa and Mobile read 356, 298, 609 and 56 once late records had arrived, their usual levels. We plot the flight-record count; the daily rollup briefly stored 204, because the 15:25 UTC refresh on 26 October re-counted the day from 15:25 UTC onward and dropped the 139 movements before then — the same partial re-count we described for 19–22 October — which is why the PNS airport page marked 23 October as a collection gap; the nightly refresh at about 02:30 UTC on 27 October restored it to 343 and the flag has cleared. The flight records for the day were whole throughout. As with 19–22 October, a surplus is outside what this page's tests are built to attribute: we report it and do not guess at its cause. Settled: the third pass added six movements, none changing the narrative.
- 24 October has settled at 298 (151 departures, 147 arrivals), +14% against ~261 — a Saturday, the sixth day in a row above the reference, one up on the 297 we published on the previous update: the feed's third nightly pass for the day, at about 02:30 UTC on 27 October, added one departure, at 22:54 UTC. Feed-wide the day now holds about 141,800 departures from about 6,420 airports, 90% of the 9 October level (17 October, the previous Saturday, held 84%). At Pensacola the shape is the normal one: 8, 10, 6, 2 and 3 an hour from 00:00 to 04:59 UTC, then 24, 15, 32, 27, 30, 23, 20, 22, 13 and 21 from 12:00 to 21:59 UTC (unchanged from the second pass). 95 of the 298 are under airline-style flight numbers — just above the 87–94 a day of 5–8 October — and the rest is private and local flying above its usual level: 114 distinct departing callsigns against 95–98 on a reference day, and 27 flights with both ends at Pensacola, 54 of the 298 movements. 298 sits just above each of the airport's three September Saturdays (173–293). New Orleans, Birmingham, Tampa and Mobile read 295, 234, 539 and 45 once late records had arrived, their usual Saturday levels. We plot the flight-record count; the daily rollup briefly stored 101, because the 18:25 UTC refresh on 27 October re-counted the day from 18:25 UTC onward and dropped the 197 movements before then — the same partial re-count we described for 19–23 October — which is why the PNS airport page marked 24 October as a collection gap for a day; the nightly refresh at about 02:30 UTC on 28 October restored it to 298 and the flag has cleared. The flight records for the day were whole throughout. As with 19–23 October, a surplus is outside what this page's tests are built to attribute: we report it and do not guess at its cause. Settled: the third pass added one movement, none changing the narrative.
- 25 October has settled at 263 (132 departures, 131 arrivals), +1% against ~261 — a Sunday, two up on the 261 we published on the previous update: the feed's third nightly pass for the day, at about 02:30 UTC on 28 October, added one departure, at 21:09 UTC, and one arrival, at 23:57 UTC. Within one per cent of the reference, it is the first day since 18 October not clearly above it, and ends the run of six surplus days. Feed-wide the day now holds about 136,100 departures from about 6,000 airports, 86% of the 9 October level — still thinner than 18 October, the previous Sunday, at 92%. At Pensacola the shape is the normal one: 7, 3, 4, 4 and 2 an hour from 00:00 to 04:59 UTC, then 18, 12, 18, 20, 21, 22, 25, 22, 22 and 22 from 12:00 to 21:59 UTC. 97 of the 263 are under airline-style flight numbers — above the 87–94 a day of 5–8 October — and the private and local flying has come down from the six days before: 107 distinct departing callsigns, against 108–124 on 19–24 October and 95–98 on a reference day, and 21 flights with both ends at Pensacola, 42 of the 263 movements. 263 sits inside the range of the airport's three September Sundays (231–292). New Orleans, Birmingham and Mobile read 311, 226 and 37 once late records had arrived, their usual Sunday levels, and Tampa 569, a little above its own. We plot the flight-record count; the daily rollup briefly stored 39, because the 21:25 UTC refresh on 28 October re-counted the day from 21:25 UTC onward and dropped the movements before then — the same partial re-count we described for 19–24 October — which is why the PNS airport page marked 25 October as a collection gap for a day; the nightly refresh at about 02:30 UTC on 29 October restored it to 263 and the flag has cleared. The flight records for the day were whole throughout. Fifteen days after landfall and back at the reference, there is nothing here for this page's tests to attribute. Settled: the third pass added two movements, none changing the narrative.
- 26 October has settled at 312 (157 departures, 155 arrivals), +20% against ~261 — a Monday, above the reference again after one Sunday at it, four up on the 308 we published on the previous update: the feed's third nightly pass for the day, at about 02:30 UTC on 29 October, added two departures, at 19:11 and 22:27 UTC, and two arrivals, both after 23:50 UTC. Feed-wide the day now holds about 144,900 departures from about 6,190 airports, 92% of the 9 October level (19 October, the previous Monday, held 98%). At Pensacola the shape is the normal one: 13, 8, 7, 6 and 6 an hour from 00:00 to 04:59 UTC, then 18, 13, 25, 20, 20, 25, 21, 31, 20 and 20 from 12:00 to 21:59 UTC (one more in the 19:00 UTC hour than at the second pass). 91 of the 312 are under airline-style flight numbers — inside the 87–94 a day of 5–8 October — and the rest is private and local flying above its usual level again: 112 distinct departing callsigns against 95–98 on a reference day, and 42 flights with both ends at Pensacola, 84 of the 312 movements. 312 sits above each of the airport's three September Mondays (253–303) but inside the range of its 23 September reference days (the highest of them 320). New Orleans, Birmingham, Tampa and Mobile read 341, 268, 605 and 53 once late records had arrived, their usual levels. We plot the flight-record count; the daily rollup briefly stored 56, because the 21:25 UTC refresh on 29 October re-counted the day from 21:25 UTC onward and dropped the 256 movements before then — the same partial re-count we described for 19–25 October — which is why the PNS airport page marked 26 October as a collection gap; a later nightly refresh restored it to 312 and the flag has cleared. The flight records for the day were whole throughout. Sixteen days after landfall; a surplus is outside what this page's tests are built to attribute, and we do not. Settled: the third pass added four movements, none changing the narrative.
- 27 October has settled at 355 (178 departures, 177 arrivals), +36% against ~261 — a Tuesday, the second day in a row above the reference, six up on the 349 we published on the previous update: the feed's third nightly pass for the day, at about 02:30 UTC on 30 October, added two departures, at 21:25 and 22:04 UTC, and four arrivals, all after 23:50 UTC. Feed-wide the day now holds about 148,600 departures from about 6,850 airports, 94% of the 9 October level (20 October, the previous Tuesday, held 98%). It is now the joint eighth-highest day in the 60 days we hold, level with 8 November, after 14 October (384), 22 October (381), 29 October (373), 15 October (369), 21 October (360), 20 October (359) and 6 November (358), and sits above each of the airport's four September Tuesdays (206–320; the September high was 320, on 15 September). At Pensacola the shape is the normal one, fuller: 6, 13, 8, 7 and 6 an hour from 00:00 to 04:59 UTC, then 23, 15, 36, 24, 28, 31, 28, 32, 28 and 23 from 12:00 to 21:59 UTC (one more in the 21:00 UTC hour than at the second pass). 98 of the 355 are under airline-style flight numbers — above the 87–94 a day of 5–8 October — and the rest is private and local flying above its usual level: 120 distinct departing callsigns against 95–98 on a reference day, and 40 flights with both ends at Pensacola, 80 of the 355 movements. New Orleans, Birmingham, Tampa and Mobile read 355, 302, 600 and 55 once late records had arrived, their usual levels. We plot the flight-record count; the daily rollup briefly stored 347, because the 00:25 UTC refresh on 30 October re-counted the day from 00:25 UTC onward and dropped two departures logged at 00:17 and 00:22 UTC — the same partial re-count, on a much smaller scale; a later refresh has brought it to 355, matching the flight records. Seventeen days after landfall; a surplus is outside what this page's tests are built to attribute, and we do not. Settled: the third pass added six movements, none changing the narrative.
- 28 October has settled at 335 (160 departures, 175 arrivals), +28% against ~261 — a Wednesday, the third day in a row above the reference. All three of the feed's nightly passes for the day are in — the bulk at about 02:30 UTC on 30 October, the third at about 02:30 UTC on 31 October, adding three departures and one arrival, all after 20:30 UTC — and feed-wide the day is whole: about 150,400 departures from about 6,580 airports, 96% of the 9 October level (21 October, the previous Wednesday, held 96%). At Pensacola the shape is the normal one, fuller: 13, 3, 8, 8 and 6 an hour from 00:00 to 04:59 UTC, then 24, 24, 26, 25, 22, 38, 29, 24, 25 and 18 from 12:00 to 21:59 UTC. 92 of the 335 are under airline-style flight numbers — inside the 87–94 a day of 5–8 October — and the rest is private and local flying above its usual level: 103 distinct departing callsigns against 95–98 on a reference day, and 52 flights with both ends at Pensacola, 104 of the 335 movements. 335 sits above each of the airport's four September Wednesdays (244–295) and above its September high of 320. New Orleans, Birmingham, Tampa and Mobile read 322, 257, 553 and 41 once late records had arrived, their usual levels. We plot the flight-record count; the daily rollup briefly stored 304, because the 03:25 UTC refresh on 31 October re-counted the day from 03:25 UTC onward and dropped the 31 movements before then — the same partial re-count we described for 19–27 October; the nightly refresh on 1 November restored it to 335, matching the flight records, which were whole throughout. Eighteen days after landfall; a surplus is outside what this page's tests are built to attribute, and we do not. Settled: the third pass added four movements, none changing the narrative.
- 29 October has settled at 373 (191 departures, 182 arrivals), +43% against ~261 — a Thursday, the fourth day in a row above the reference, one up on the 372 we published on the previous update: the feed's third nightly pass for the day, at about 02:30 UTC on 1 November, added one departure, at 22:30 UTC. Feed-wide the day now holds about 154,300 departures from about 6,470 airports, 98% of the 9 October level (22 October, the previous Thursday, was level with it). It is the third-highest day in the 60 days we hold, after 14 October (384) and 22 October (381), and sits above each of the airport's three September Thursdays (171–308) and above its September high of 320. At Pensacola the shape is the normal one, fuller: 12, 7, 11, 11 and 3 an hour from 00:00 to 04:59 UTC, then 13, 21, 25, 28, 31, 33, 35, 39, 28 and 28 from 12:00 to 21:59 UTC. 90 of the 373 are under airline-style flight numbers — inside the 87–94 a day of 5–8 October — and the rest is private and local flying above its usual level: 121 distinct departing callsigns against 95–98 on a reference day, and 38 flights with both ends at Pensacola, 76 of the 373 movements. New Orleans, Birmingham, Tampa and Mobile read 330, 298, 605 and 53 once late records had arrived, their usual levels. We plot the flight-record count; the daily rollup stores 326, because the 06:25 UTC refresh on 1 November re-counted the day from 06:25 UTC onward and dropped the 47 movements before then — the same partial re-count we described for 19–28 October — which is why the PNS airport page shows 326 for the day until a nightly refresh restores it; the flight records for the day are whole. Nineteen days after landfall; a surplus is outside what this page's tests are built to attribute, and we do not. Settled: the third pass added one movement, none changing the narrative.
- 30 October reads 287 (144 departures, 143 arrivals), +10% against ~261 — a Friday, the fifth day in a row above the reference and the narrowest margin of the five: it sits inside the airport's own September Friday range (151–319) and below its September high of 320. The feed's second nightly pass for the day landed at about 02:30 UTC on 1 November; feed-wide the day holds about 148,900 departures from about 6,220 airports, 95% of the 9 October level (23 October, the previous Friday, was level with it), and the third pass never arrived: neither the nightly run at about 02:30 UTC on 2 November nor the one on 3 November carried records for 30 October anywhere in the feed, so the count is unchanged and may sit a few movements short. At Pensacola the shape is the normal one: 15, 8, 10, 4 and 6 an hour from 00:00 to 04:59 UTC, then 15, 9, 16, 23, 34, 22, 21, 19, 26 and 18 from 12:00 to 21:59 UTC. 92 of the 287 are under airline-style flight numbers — inside the 87–94 a day of 5–8 October — and private and local flying is still above its usual level: 107 distinct departing callsigns against 95–98 on a reference day, and 30 flights with both ends at Pensacola, 60 of the 287 movements. New Orleans, Birmingham, Tampa and Mobile read 365, 283, 617 and 43, their usual levels. We plot the flight-record count; the daily rollup briefly stored 243, because the 09:25 UTC refresh on 2 November re-counted the day from 09:25 UTC onward and dropped the 44 movements before then — the same partial re-count we described for 19–29 October; the nightly refresh on 3 November restored it to 287, matching the flight records. Twenty days after landfall; a surplus is outside what this page's tests are built to attribute, and we do not. We treat 287 as final for the day, with that caveat.
- 31 October has settled at 237 (120 departures, 117 arrivals), −9% against ~261 — a Saturday, the first day below the reference since 18 October, after five days above it; it sits inside the airport's own September Saturday range (173–293). All three of the feed's nightly passes for the day are in — the bulk at about 02:30 UTC on 2 November, lighter than usual, and the third at about 02:30 UTC on 3 November, adding one departure, a private flight at 23:46 UTC, one up on the 236 we published on the previous update. Feed-wide the day holds about 128,500 departures from about 5,660 airports, 82% of the 9 October level, against 90% for 24 October, the previous Saturday. At Pensacola the shape is the normal one: 11, 12, 8, 3 and 7 an hour from 00:00 to 04:59 UTC, then 18, 16, 20, 17, 23, 21, 15, 16, 13 and 13 from 12:00 to 21:59 UTC. 87 of the 237 are under airline-style flight numbers — at the bottom of the 87–94 a day of 5–8 October — with 91 distinct departing callsigns against 95–98 on a reference day, and 30 flights with both ends at Pensacola, 60 of the 237 movements. New Orleans, Birmingham, Tampa and Mobile read 287, 194, 517 and 22, each below its previous Saturday (295, 234, 539 and 45), in line with the thinner feed day. We plot the flight-record count; the daily rollup briefly stored 171, because the 12:25 UTC refresh on 3 November re-counted the day from 12:25 UTC onward and dropped the 66 movements before then — the same partial re-count we described for 19–30 October; the nightly refresh on 4 November restored it to 237, matching the flight records, and the partial flag has cleared. Twenty-one days after landfall; one day below the reference and inside the airport's own range is not a shortfall this page's tests attribute to the storm, and we do not.
- 1 November has settled at 99 (51 departures, 48 arrivals), −62% against ~261 — a Sunday, below the airport's own September Sunday range (231–292), the lowest day since 12 October and below its early-October low of 111. All three of the feed's nightly passes for the day are in: the third, at about 02:30 UTC on 4 November, added one departure, an airline flight at 21:26 UTC, one up on the 98 we described on the previous update. The day is thin across the airport's normal hours rather than missing a block of them: 5, 1, 2, 4, 2 and 1 an hour from 00:00 to 05:59 UTC, then 3 to 12 an hour from 11:00 to 23:59 UTC. 61 of the 99 are under airline-style flight numbers — against 87–94 a day on 5–8 October and 97 on 25 October, the previous Sunday — with 50 distinct departing callsigns against 95–98 on a reference day, and 3 flights with both ends at Pensacola, 6 movements, against 21 such flights the previous Sunday. Feed-wide the day holds about 119,000 departures from about 5,180 airports, 76% of the 9 October level and 80% of the median of the 14 days before it — a whole day by our collection rule, so we publish the count — and the feed reads thin at airports of Pensacola's size: across 121 US airports with 150–600 movements on 26 October, the median reads 29% below its previous Sunday, and 23 of them fell further than Pensacola's 62%. New Orleans, Birmingham, Tampa and Mobile read 244, 164, 508 and 17, each below its previous Sunday (311, 226, 569 and 37); the second, thinner receiver network shows drops of about a fifth at New Orleans and about a quarter at Birmingham too, but sees too little at Pensacola to cross-check it. Pensacola's weather reports show marginal or instrument flight conditions under low cloud from 07:00 to 20:59 UTC. The daily rollup briefly stored 64, because the 15:25 UTC refresh on 4 November re-counted the day from 15:25 UTC onward and dropped the 35 movements before then — the same partial re-count we described for 19–31 October; the nightly refresh on 5 November restored it to 99, matching the flight records, and the partial flag has cleared.
- 2 November has settled at 158 (78 departures, 80 arrivals), −39% against ~261 — a Monday, below the airport's own September Mondays (253–303) and level with 17 October's 158. All three of the feed's nightly passes for the day are in: the third, at about 02:30 UTC on 5 November, added one arrival, a private flight at 23:59 UTC, one up on the 157 we published on the previous update. Feed-wide the day now holds about 131,800 departures from about 5,220 airports, 84% of the 9 October level and 88% of the 14-day median, against 92% for 26 October, the previous Monday. At Pensacola the day is again thin across its normal hours rather than missing a block of them: below the previous Monday in eleven of the twelve hours from 12:00 to 23:59 UTC and level with it in the twelfth. 72 of the 158 are under airline-style flight numbers, against 91 on 26 October, with 71 distinct departing callsigns, and 17 flights with both ends at Pensacola, 34 movements, against 42 such flights the previous Monday. With the day settled, across the 123 US airports with 150–600 movements on 26 October the median reads 18% below its previous Monday, and 17 of them fell further than Pensacola's 49%. New Orleans, Birmingham, Tampa and Mobile read 338, 230, 590 and 33, against 341, 268, 605 and 53 the previous Monday; the second network reads New Orleans and Tampa level with their previous Monday. Pensacola's weather reports show instrument or marginal flight conditions under low cloud from 02:00 to 19:59 UTC, clearing from 20:00 UTC. The daily rollup briefly stored 77, because the 18:25 UTC refresh on 5 November re-counted the day from 18:25 UTC onward and dropped the 81 movements before then — the same partial re-count we described for 19 October–1 November; a later refresh restored it to 158, matching the flight records, and the partial flag has cleared. Twenty-two and twenty-three days after landfall, with no storm-tied notice since 10 October, we do not attribute 1 or 2 November to Isaias: part of the drop matches the thin feed, the steepest fall is in local flying, on two days of low cloud, and from this feed alone we cannot tell how much was fewer flights and how much thinner receiver coverage, so we do not guess.
- 3 November reads 149 (72 departures, 77 arrivals), −43% against ~261 — a Tuesday, below the airport's own September Tuesdays (206–320) and, apart from 1 November, the lowest day since 12 October. The feed's second nightly pass for the day landed at about 02:30 UTC on 5 November; feed-wide the day holds about 134,300 departures from about 5,500 airports, 85% of the 9 October level and 90% of the 14-day median, against 94% for 27 October, the previous Tuesday — closer to a normal day than 1 or 2 November. The third pass did not arrive: the feed's nightly runs at about 02:30 UTC on 6 and 7 November carried no records for 3 November anywhere in the feed, so the count is final without it and may sit a few movements short. At Pensacola the shortfall is in the daytime: the six hours from 00:00 to 05:59 UTC read close to the previous Tuesday (30 movements against 42), but all twelve hours from 12:00 to 23:59 UTC are below it (3 to 17 an hour, against 12 to 36). 68 of the 149 are under airline-style flight numbers, against 98 on 27 October, with 66 distinct departing callsigns, and 12 flights with both ends at Pensacola, 24 movements, against 40 such flights the previous Tuesday. Across the same 123 US airports the median reads 14% below its previous Tuesday, and 7 of them fell further than Pensacola's 58%. New Orleans, Birmingham, Tampa and Mobile read 310, 253, 594 and 46, against 355, 302, 600 and 55 the previous Tuesday — Tampa level, the other three 13–16% lower, all far less than Pensacola. Pensacola's weather reports show marginal flight conditions from 08:53 to 17:53 UTC and again from 22:05 UTC. The daily rollup briefly stored 16, because the 21:25 UTC refresh on 6 November re-counted the day from 21:25 UTC onward and dropped the 133 movements before then — the same partial re-count we described for 19 October–2 November; the nightly refresh on 7 November restored it to 149, matching the flight records, and the partial flag has cleared. On a day when the feed and the neighbouring airports read far closer to normal, Pensacola stays at well under half its previous Tuesday — the third day running below its own range, and the first of the three that a thin feed does not largely explain. Twenty-four days after landfall, with no storm-tied notice since 10 October, we do not attribute it to Isaias; from this feed alone we cannot tell whether the shortfall is fewer flights or thinner receiver coverage at the airport, so that question stays open and we do not guess. Final without its third pass, as with 30 October.
- 4 November has settled at 141 (70 departures, 71 arrivals), −46% against ~261 — a Wednesday, below the airport's own September Wednesdays (244–295), the fourth day running below its own range and, apart from 1 November, the lowest day since 12 October. All three of the feed's nightly passes for the day are in: the third, at about 02:30 UTC on 7 November, added one arrival under an airline flight number, one up on the 140 we published on the previous update. Feed-wide the day now holds about 138,600 departures from about 5,800 airports, 88% of the 9 October level and 94% of the 14-day median, against 101% for 28 October, the previous Wednesday. At Pensacola the day is thin across its normal hours rather than missing a block of them: 15 movements from 00:00 to 05:59 UTC against 38 the previous Wednesday, and below it in eleven of the twelve hours from 12:00 to 23:59 UTC (3 to 19 an hour, against 14 to 38). 81 of the 141 are under airline-style flight numbers, against 92 on 28 October and 68 on 3 November, with 66 distinct departing callsigns, and 9 flights with both ends at Pensacola, 18 movements, against 52 such flights the previous Wednesday — the airline count is 11 below the previous Wednesday, and the rest of the 194-movement gap is private and local flying. Across the same 123 US airports the median reads 8% below its previous Wednesday, and 11 of them fell further than Pensacola's 58%. New Orleans, Birmingham, Tampa and Mobile read 288, 219, 570 and 40, against 322, 257, 553 and 41 the previous Wednesday — Tampa and Mobile level, New Orleans and Birmingham 11–15% lower, all far less than Pensacola. Pensacola's weather reports show instrument or marginal flight conditions in rain, mist and fog almost continuously from 05:20 to 15:04 UTC — fog down to a quarter of a mile at times between 09:20 and 12:46 UTC — and marginal conditions under low cloud again from 19:53 to 22:59 UTC; the airport also read below its previous Wednesday in the mostly visual afternoon hours from 15:00 to 18:59 UTC (8 to 17 an hour, against 22 to 38). We plot the flight-record count; the daily rollup stores 18, because the 21:25 UTC refresh on 7 November re-counted the day from 21:25 UTC onward and dropped the 123 movements before then — the same partial re-count we described for 19 October–3 November — which is why the PNS airport page shows 18 for the day, flagged as partial, until a nightly refresh restores it; the flight records for the day are unaffected. Twenty-five days after landfall, with no storm-tied notice since 10 October, we do not attribute it to Isaias; as on 3 November, from this feed alone we cannot tell whether the shortfall is fewer flights or thinner receiver coverage at the airport, so that question stays open and we do not guess.
- 5 November has settled at 213 (104 departures, 109 arrivals), −18% against ~261 — a Thursday, inside the airport's own September Thursdays (171–308) and the first day back inside its own range for the weekday since 31 October, though still 43% below 29 October, the previous Thursday (373, a surplus day). All three of the feed's nightly passes for the day are in: the third, at about 02:30 UTC on 8 November, added two private departures, at 22:46 and 23:30 UTC, two up on the 211 we published on the previous update. Feed-wide the day now holds about 145,900 departures from about 5,980 airports, 93% of the 9 October level. 86 of the 213 are under airline-style flight numbers — just below the pre-storm 87–94, against 90 on 29 October — with 98 distinct departing callsigns, and 23 flights with both ends at Pensacola, 46 movements, against 38 such flights the previous Thursday: the airline count is back near its usual level, and most of the gap to the previous Thursday is private and local flying. By hour the shortfall sits in the daytime: 97 movements from 12:00 to 19:59 UTC against 225 the previous Thursday, while the four hours from 20:00 to 23:59 UTC read 92 against 88. Pensacola's weather reports show instrument or marginal flight conditions in rain and low cloud, with ceilings down to 500 ft, for most of 07:26 to 19:53 UTC. On the second pass, across the same 123 US airports the median read 9% below its previous Thursday, and 17 of them fell further than Pensacola. New Orleans, Birmingham, Tampa and Mobile now read 350, 258, 603 and 48, against 330, 298, 605 and 53 the previous Thursday. The daily rollup now matches the flight records. Twenty-six days after landfall, this is not a shortfall this page attributes.
- 6 November has settled at 358 (168 departures, 190 arrivals), +37% against ~261 — a Friday, above each of the airport's three September Fridays (151–319) and 25% above 30 October, the previous Friday (287). It is the seventh-highest day in the 60 days we hold, after 14 October (384), 22 October (381), 29 October (373), 15 October (369), 21 October (360) and 20 October (359). All three of the feed's nightly passes for the day are in: the third, at about 02:30 UTC on 9 November, added one departure and two arrivals, all private and all after 22:40 UTC. Feed-wide the day holds about 145,600 departures from about 6,050 airports, 92% of the 9 October level. 84 of the 358 are under airline-style flight numbers — just below the pre-storm 87–94, against 92 on 30 October — with 111 distinct departing callsigns, and 48 flights with both ends at Pensacola, 96 movements, against 30 such flights the previous Friday: the surplus is private and local flying, as on the surplus days of late October. It sits in the daytime: every hour from 12:00 to 21:59 UTC reads 19 to 38 movements, against 9 to 34 the previous Friday. Pensacola's weather reports show low cloud and fog, down to instrument conditions, from 02:53 to 07:23 UTC, outside the busy hours, and visual conditions for the rest of the day. New Orleans, Birmingham, Tampa and Mobile read 371, 285, 600 and 48, against 365, 283, 617 and 43 the previous Friday — their usual levels. We plot the flight-record count; the daily rollup stored 336, because the 03:25 UTC refresh on 9 November re-counted the day from 03:25 UTC onward and dropped the 22 movements before then — the same partial re-count we described for 19 October–4 November; the nightly refresh on 10 November restored it to 358, matching the flight records. Twenty-seven days after landfall, a day above the reference is not something any test on this page is built to attribute, and we do not.
- 7 November has settled at 324 (158 departures, 166 arrivals), +24% against ~261 — a Saturday, above each of the airport's three September Saturdays (173–293) and 37% above 31 October, the previous Saturday (237). All three of the feed's nightly passes for the day are in: the third, at about 02:30 UTC on 10 November, added no movements at Pensacola, so the count is unchanged from the previous update. Feed-wide the day holds about 131,200 departures from about 5,900 airports, 83% of the 9 October level, against about 128,500 for 31 October. 84 of the 324 are under airline-style flight numbers, against 87 on 31 October, with 104 distinct departing callsigns, and 45 flights with both ends at Pensacola, 90 movements, against 30 such flights the previous Saturday — again a surplus in private and local flying. Pensacola's weather reports show visual conditions all day. New Orleans, Birmingham, Tampa and Mobile read 222, 230, 583 and 53, against 287, 194, 517 and 22 the previous Saturday. We plot the flight-record count; the daily rollup stored 275, because the 06:25 UTC refresh on 10 November re-counted the day from 06:25 UTC onward and dropped the 49 movements before then — the same partial re-count we described for 19 October–6 November; the nightly refresh on 11 November restored it to 324, matching the flight records. Twenty-eight days after landfall, we do not attribute it.
- 8 November has settled at 355 (183 departures, 172 arrivals), +36% against ~261 — a Sunday, the highest Sunday in the window drawn above, above each of the airport's three September Sundays (231–292) and far above 1 November, the previous Sunday (99). It sits level with 27 October as the joint eighth-highest day in the 60 days we hold. All three of the feed's nightly passes for the day are in: the third, at about 02:30 UTC on 11 November, added no movements at Pensacola, so the count is unchanged from the previous update. Feed-wide the day holds about 131,800 departures from about 5,740 airports, 84% of the 9 October level, against about 119,000 for 1 November. 90 of the 355 are under airline-style flight numbers, inside the pre-storm 87–94 and against 61 on 1 November, with 124 distinct departing callsigns, and 50 flights with both ends at Pensacola, against 3 the previous Sunday — the surplus again in private and local flying. At Pensacola the shape is the normal one: 35 movements from 00:00 to 05:59 UTC, then 12 to 38 an hour from 12:00 to 21:59 UTC. New Orleans, Birmingham, Tampa and Mobile read 286, 215, 559 and 45, against 244, 164, 508 and 17 the previous Sunday. We plot the flight-record count; the daily rollup stores 318, because the 09:25 UTC refresh on 11 November re-counted the day from 09:25 UTC onward and dropped the 37 movements before then — the same partial re-count we described for 19 October–7 November — which is why the PNS airport page shows 318 for the day until a nightly refresh restores it; the flight records for the day are unaffected. Twenty-nine days after landfall, we do not attribute it.
- 9 November reads 335 (168 departures, 167 arrivals), +28% against ~261 — a Monday, the highest Monday in the window drawn above, above each of the airport's three September Mondays (253–303) and more than double 2 November, the previous Monday (158); it is level with 28 October (335). The feed's second nightly pass for the day landed at about 02:30 UTC on 11 November; feed-wide the day holds about 136,200 departures from about 5,860 airports so far, 87% of the 9 October level, against about 131,800 for 2 November once settled. 83 of the 335 are under airline-style flight numbers, just below the pre-storm 87–94 and against 72 on 2 November, with 121 distinct departing callsigns, and 47 flights with both ends at Pensacola, against 17 the previous Monday — the surplus again in private and local flying. At Pensacola the shape is the normal one: 38 movements from 00:00 to 05:59 UTC, then 14 to 40 an hour from 12:00 to 21:59 UTC, and Pensacola's weather reports show visual conditions all day. New Orleans, Birmingham, Tampa and Mobile read 336, 254, 609 and 43 so far, against 338, 230, 590 and 33 the previous Monday. The daily rollup matches the flight records. Thirty days after landfall, we do not attribute it. Final without its third pass: the nightly batches of 12 and 13 November failed feed-wide, so 9 November stays at its second-pass count.
- Coverage note: Pensacola and New Orleans have usable crowdsourced ADS-B coverage on normal days, so we publish their counts. Several smaller coastal airports nearby — Destin–Fort Walton Beach (VPS), Panama City (ECP), Gulfport (GPT) — are not among the airports we publish briefs for, so we print no counts for them here.
The rule this page applies: a count publishes when its day is collected and can be called a whole day, and an effect is attributed to the storm only when it appears after the storm is close enough to matter and is deeper than what the airport does on its own. 9, 10, 11 and 12 October all meet both tests — 54, 0, 6 and 22 against ~261, with New Orleans and Tampa at their usual levels on each of those days. 13 October (151) meets the first test and not the second, so it is reported as recovery under way, not attributed. 14 October (384, +47%) and 15 October (369, +41%) are above the reference, not below it — the first two days since the storm with more traffic than normal, which no test on this page is built to attribute, and we do not. 16 October (301, +15%) is back inside the airport's own September range. 17 October (158, −39%) is a Saturday with the airline count above pre-storm levels and the drop in private and local flying — seven days after landfall, and we do not attribute it. 18 October (238, −9%, settled) is a Sunday with the airline count just below pre-storm levels, inside the airport's own September Sunday range, and we do not attribute it either. 19 October (317, +21%), 20 October (359, +38%), 21 October (360, +38%), 22 October (381, +46%), 23 October (343, +31%) and 24 October (298, +14%), all settled, are above the reference again, with the airline count at or near its pre-storm level and the surplus in private and local flying — which no test on this page is built to attribute, and we do not. 25 October (263, +1%, settled) is a Sunday within one per cent of the reference, inside the airport's own September Sunday range, with the airline count above its pre-storm level. 26 October (312, +20%), 27 October (355, +36%), 28 October (335, +28%) and 29 October (373, +43%), all settled, and 30 October (287, +10%, final without its third pass) are above the reference again — a Monday to a Friday, with the airline count inside or above its pre-storm range and the surplus in private and local flying, narrowest on the Friday, which sits inside the airport's own September Friday range — which no test on this page is built to attribute, and we do not. 31 October (237, −9%, settled) is a Saturday below the reference, inside the airport's own September Saturday range, with the airline count at the bottom of its pre-storm range. 1 November (99, −62%, settled) goes deeper than the airport's own early-October low of 111 but falls 22 days after landfall, long after the storm was close enough to matter, with no storm-tied notice since 10 October; 2 November (158, −39%, settled), 3 November (149, −43%, final without its third pass) and 4 November (141, −46%, settled) are inside that early-October range and meet neither test. All four are whole days by our collection rule, so we publish them, with the airline count below its pre-storm range on each; the feed read thin at US airports of Pensacola's size on 1 and 2 November, much less so on 3 and 4 November, when Pensacola stayed low while its neighbours read close to their usual level — a shortfall local to the airport whose cause this feed cannot establish. We attribute none of the four to Isaias. 5 November (213, −18%, settled) is back inside the airport's own September Thursday range, with the airline count near its pre-storm level, and is not a shortfall this page attributes. 6 November (358, +37%), 7 November (324, +24%) and 8 November (355, +36%), all settled, and 9 November (335, +28%, final without its third pass) are above the reference again — a Friday to a Monday, each above the airport's own September range for the weekday, with the airline count just below or inside its pre-storm range and the surplus in private and local flying — which no test on this page is built to attribute, and we do not. Live view: PNS airport brief.
What it means for flights
Why the Gulf's oceanic FIRs were in scope before any airport was. Isaias spent nearly its whole life over the Gulf of Mexico, so the first airspace it touched was oceanic: it formed inside the Mexico FIR (MMFR), which carried tropical-cyclone SIGMETs from 08:57 UTC on 7 October to 03:16 UTC on 9 October, and from 21:15 UTC on 8 October the Houston and Miami Oceanic FIRs (KZHU/KZMA) carried a joint international tropical-cyclone SIGMET series, the last valid to 21:15 UTC on 9 October. Those SIGMETs described frequent thunderstorms with tops to FL520–FL590 — well above any airliner's cruise level, which is why the operational answer is to route around a storm like this, not over it. A follow-on international series over the eastern Gulf from 20:30 UTC on 9 October describes a thunderstorm area without naming the storm, so we do not count it here. FIR-level signals are labelled as FIR-level throughout this page; Pensacola and Tampa sit in the Jacksonville FIR (KZJX) and New Orleans in the Houston FIR (KZHU).
Hurricanes stop airports differently than ash does. Ash is an engine problem that can keep aircraft on the ground for days; wind is a runway problem. Operations pause when crosswind and gust limits are exceeded and ground handling can no longer work, and they resume once the wind drops and the field is inspected. That makes hurricane disruption front-loaded: airlines cancel in waves before the storm arrives and move aircraft out of its path, so the first traffic signal often shows up a day or more ahead of the closest approach. It is also why the useful numbers during an approach are distance, motion and timing rather than the headline category — a storm's wind field and rain bands reach the coast well before its centre does.
A storm that peaked offshore and came ashore weaker. Isaias went from a 30 kt depression on the evening of 6 October to 105 kt by midday on 9 October — 70 kt to 105 kt in roughly 24 hours, past the conventional 30-kt-in-a-day mark for rapid intensification — and held 105 kt until 20:00 UTC. It eased to 90 kt by the time the centre reached the coast at 01:30 UTC on 10 October and lost hurricane strength within about five hours inland. Pensacola's weather observations show the wind field arriving well before the centre: gusts of 29 kt with heavy rain at 17:53 UTC on 9 October, 50 kt at 21:12 UTC, and a peak gust of 80 kt at 23:46 UTC, with sustained wind of 38 kt and 2½ miles' visibility in rain with thunderstorms nearby; the wind then swung round to the north-west with gusts of 73–74 kt at 01:06 and 02:45 UTC, fell under 30 kt by 04:53 UTC, and by 14:53 UTC read 9 kt with 10 miles' visibility. US domestic convective SIGMETs tied to the storm — 28 from 04:55 UTC on 9 October — tracked its arrival: between 18:55 UTC on 9 October and 02:55 UTC on 10 October they carried tops above FL450 and warned of tornadoes and gusts to 130 kt possible over Florida, Georgia, Alabama, Mississippi and Louisiana and their coastal waters.
What the operational feeds say right now — and what they do not. Three findings. First, the storm-tied SIGMET picture has ended: the oceanic tropical-cyclone series lapsed at 21:15 UTC on 9 October and the last convective SIGMET tied to Isaias expired at 09:55 UTC on 10 October; our SIGMET ingest is current to 12:36 UTC on 13 November, and no notice tied to Isaias has appeared since — the tropical-cyclone SIGMETs the Mexico FIR has carried from 21:00 UTC on 23 October name a different storm, Vance. Second, we make no NOTAM claim for this event: we do not currently hold a complete notice set for the Jacksonville and Houston FIRs, so an absence of notices in our feed would mean nothing here; airport and airspace closures are published through the FAA's NOTAM system. Third, the storm-attributable traffic change is now measured on the approach day, the landfall day and the two days after. Pensacola read 282 on 7 October (+8%), 226 on 8 October (−13%, inside its own range, with the storm at least 640 km away), 54 on 9 October (−79%; the daily rollup has since settled at the same figure), with nothing logged after 15:28 UTC while New Orleans, Birmingham and Tampa kept their usual afternoon traffic; 0 on 10 October (−100%), the day the centre crossed the coast 66 km to the east — no flight record at all at Pensacola on a day that is whole feed-wide, with Mobile, New Orleans and Tampa at their usual levels, consistent with the 90 kt wind field arriving at 01:30 UTC; 6 on 11 October (−98%): one departure and five arrivals, four of them under airline flight numbers and the first logged since 15:28 UTC on 9 October, while New Orleans, Birmingham and Tampa read 312, 250 and 511; and 22 on 12 October (−92%), a run of airline departures from 10:29 UTC and nothing logged after 13:55 UTC, while New Orleans, Birmingham and Tampa read 357, 283 and 606 — a day on which a second, thinner receiver network saw more at Pensacola than our main feed did, so part of that silence may be coverage rather than flights. 151 on 13 October (−42%) is the first day with the airport's normal hour-by-hour shape back, with 63 movements under airline flight numbers against 87–94 before the storm; it sits inside the range the airport posted on its own on 1–6 October, so under this page's rule it is reported as recovery under way, not attributed. 384 on 14 October (+47%, now settled) is the airport's highest day in the 60 days we hold: 95 movements under airline flight numbers, level with the pre-storm 87–94, and the private and local flying that had dropped out in early October now above its usual level, while New Orleans, Birmingham, Tampa and Mobile read 332, 363, 534 and 42. 369 on 15 October (+41%, now settled) is now the fourth-highest, with 85 under airline flight numbers and the same local-flying surplus, while those four airports read 341, 290, 573 and 48. A surplus is outside what this page's tests are built to attribute; we report both days and do not read them as a storm effect. 301 on 16 October (+15%, now settled — the third pass added four movements) has 89 under airline flight numbers and less local flying than the two days before, and sits inside the range of the airport's own September reference days (up to 320), while New Orleans, Birmingham, Tampa and Mobile read 363, 279, 614 and 51. 158 on 17 October (−39%, now settled — the third pass added four movements) — a Saturday — has 99 under airline flight numbers, above the pre-storm 87–94, and 76 distinct departing callsigns against 109–136 on the three preceding days and 95–98 on a reference day; the airline count is not only back but slightly above its pre-storm level, and the drop from the surplus days is entirely in private and local flying (5 flights with both ends at Pensacola, against 32–48 on 14–16 October); New Orleans, Birmingham, Tampa and Mobile read 314, 222, 556 and 43, their usual Saturday levels. 238 on 18 October (−9%, now settled — the third pass added two movements) — a Sunday — has 83 under airline flight numbers, just below the pre-storm 87–94, and 88 distinct departing callsigns; 17 flights with both ends at Pensacola, 34 of the 238 movements; New Orleans, Birmingham, Tampa and Mobile read 326, 254, 546 and 27, their usual Sunday levels. 238 sits below the ~261 reference but inside the airport's own September Sunday range (231–292); eight days after landfall, and we do not attribute it. 317 on 19 October (+21%, now settled) — a Monday — has 86 under airline flight numbers, just under the pre-storm 87–94, and 108 distinct departing callsigns, with 29 flights with both ends at Pensacola; it sits above each of the airport's September Mondays (253–303), while New Orleans, Birmingham, Tampa and Mobile read 339, 256, 557 and 45. 359 on 20 October (+38%, now settled — the third pass added four movements) — a Tuesday — is now the sixth-highest day in the 60 days we hold, with 91 under airline flight numbers, inside the pre-storm 87–94, and 120 distinct departing callsigns, with 37 flights with both ends at Pensacola; New Orleans, Birmingham, Tampa and Mobile read 328, 301, 590 and 56, their usual levels. 360 on 21 October (+38%, now settled — the third pass added four movements) — a Wednesday — is now the fifth-highest, with 87 under airline flight numbers, at the lower end of the pre-storm 87–94, and 124 distinct departing callsigns, with 39 flights with both ends at Pensacola; it sits above each of the airport's September Wednesdays (244–295), while New Orleans, Birmingham, Tampa and Mobile read 318, 291, 544 and 58. 381 on 22 October (+46%, now settled — the third pass added four movements) — a Thursday — is the second-highest day in the 60 days we hold, with 92 under airline flight numbers, inside the pre-storm 87–94, and 120 distinct departing callsigns, with 47 flights with both ends at Pensacola; it sits above each of the airport's September Thursdays (171–308), while New Orleans, Birmingham, Tampa and Mobile read 344, 279, 601 and 61. 343 on 23 October (+31%, now settled — the third pass added six movements) — a Friday — is now the tenth-highest day in the 60 days we hold, with 89 under airline flight numbers, inside the pre-storm 87–94, and 114 distinct departing callsigns, with 39 flights with both ends at Pensacola; it sits above each of the airport's September Fridays (151–319), while New Orleans, Birmingham, Tampa and Mobile read 356, 298, 609 and 56. 298 on 24 October (+14%, now settled — the third pass added one movement) — a Saturday — has 95 under airline flight numbers, just above the pre-storm 87–94, and 114 distinct departing callsigns, with 27 flights with both ends at Pensacola; it sits just above each of the airport's September Saturdays (173–293), while New Orleans, Birmingham, Tampa and Mobile read 295, 234, 539 and 45, their usual Saturday levels. All six are surpluses, outside what this page's tests are built to attribute, and we do not. 263 on 25 October (+1%, now settled — the third pass added two movements) — a Sunday — is within one per cent of the reference and ends that run: 97 under airline flight numbers, above the pre-storm 87–94, and 107 distinct departing callsigns, with 21 flights with both ends at Pensacola; it sits inside the airport's September Sunday range (231–292), while New Orleans, Birmingham and Mobile read 311, 226 and 37, their usual Sunday levels, and Tampa 569, a little above its own. 312 on 26 October (+20%, now settled — the third pass added four movements) — a Monday — is above the reference again: 91 under airline flight numbers, inside the pre-storm 87–94, and 112 distinct departing callsigns, with 42 flights with both ends at Pensacola; it sits above each of the airport's September Mondays (253–303) but inside its overall September range (up to 320), while New Orleans, Birmingham, Tampa and Mobile read 341, 268, 605 and 53, their usual levels. 355 on 27 October (+36%, now settled — the third pass added six movements) — a Tuesday — is above it too, and now the joint eighth-highest day in the 60 days we hold, level with 8 November: 98 under airline flight numbers, above the pre-storm 87–94, and 120 distinct departing callsigns, with 40 flights with both ends at Pensacola; it sits above each of the airport's September Tuesdays (206–320), while New Orleans, Birmingham, Tampa and Mobile read 355, 302, 600 and 55, their usual levels. 335 on 28 October (+28%, now settled — the third pass added four movements) — a Wednesday — has 92 under airline flight numbers, inside the pre-storm 87–94, and 103 distinct departing callsigns, with 52 flights with both ends at Pensacola; it sits above each of the airport's September Wednesdays (244–295) and above its September high of 320, while New Orleans, Birmingham, Tampa and Mobile read 322, 257, 553 and 41, their usual levels. 373 on 29 October (+43%, now settled — the third pass added one movement) — a Thursday — is the third-highest day in the 60 days we hold: 90 under airline flight numbers, inside the pre-storm 87–94, and 121 distinct departing callsigns, with 38 flights with both ends at Pensacola; it sits above each of the airport's September Thursdays (171–308), while New Orleans, Birmingham, Tampa and Mobile read 330, 298, 605 and 53, their usual levels. 287 on 30 October (+10%, final without its third pass) — a Friday — has 92 under airline flight numbers, inside the pre-storm 87–94, and 107 distinct departing callsigns, with 30 flights with both ends at Pensacola; it sits inside the airport's own September Friday range (151–319), while New Orleans, Birmingham, Tampa and Mobile read 365, 283, 617 and 43, their usual levels. All five are surpluses, outside what this page's tests are built to attribute, and we do not. 237 on 31 October (−9%, now settled — the third pass added one movement) — a Saturday — has 87 under airline flight numbers, at the bottom of the pre-storm 87–94, and 91 distinct departing callsigns, with 30 flights with both ends at Pensacola; it sits inside the airport's own September Saturday range (173–293), while New Orleans, Birmingham, Tampa and Mobile read 287, 194, 517 and 22, each below its previous Saturday, on a thinner-than-usual feed day. 99 on 1 November (−62%, now settled — the third pass added one movement) — a Sunday — has 61 under airline flight numbers and 50 distinct departing callsigns, with 3 flights with both ends at Pensacola; 158 on 2 November (−39%, now settled — the third pass added one movement) — a Monday — has 72 under airline flight numbers and 71 distinct departing callsigns, with 17 flights with both ends at Pensacola; 149 on 3 November (−43%, final without its third pass) — a Tuesday — has 68 under airline flight numbers and 66 distinct departing callsigns, with 12 flights with both ends at Pensacola; 141 on 4 November (−46%, now settled — the third pass added one movement) — a Wednesday — has 81 under airline flight numbers and 66 distinct departing callsigns, with 9 flights with both ends at Pensacola. All four sit below the airport's own September range for the weekday (Sundays 231–292, Mondays 253–303, Tuesdays 206–320, Wednesdays 244–295), and 1 November below its early-October low of 111; New Orleans, Birmingham, Tampa and Mobile read 244, 164, 508 and 17 on 1 November, each below its previous Sunday, and 338, 230, 590 and 33 on 2 November, close to or below its previous Monday, on two days when the feed reads thin at US airports of Pensacola's size; on 3 November they read 310, 253, 594 and 46 — Tampa level with its previous Tuesday, the other three 13–16% lower — against Pensacola's 58% drop, and on 4 November 288, 219, 570 and 40 — Tampa and Mobile level with their previous Wednesday, New Orleans and Birmingham 11–15% lower — against Pensacola's 58% drop again. None of the four days falls when the storm was close enough to matter, and we do not attribute any of them to it. 213 on 5 November (−18%, now settled — the third pass added two private departures) — a Thursday — has 86 under airline flight numbers and 98 distinct departing callsigns, with 23 flights with both ends at Pensacola, back inside the airport's own September Thursday range (171–308), while New Orleans, Birmingham, Tampa and Mobile read 350, 258, 603 and 48. 358 on 6 November (+37%, now settled) — a Friday — is the seventh-highest day in the 60 days we hold and above the airport's own September Fridays (151–319), with 84 under airline flight numbers, just below the pre-storm 87–94, 111 distinct departing callsigns and 48 flights with both ends at Pensacola, against 30 the previous Friday, while those four airports read 371, 285, 600 and 48, their usual levels. 324 on 7 November (+24%, now settled) — a Saturday — is above the airport's own September Saturdays (173–293), with 84 under airline flight numbers and 45 flights with both ends at Pensacola, against 30 the previous Saturday. 355 on 8 November (+36%, now settled) — a Sunday — is the highest Sunday in the window and above the airport's own September Sundays (231–292), with 90 under airline flight numbers, inside the pre-storm 87–94, and 50 flights with both ends at Pensacola, against 3 the previous Sunday. 335 on 9 November (+28%, final without its third pass) — a Monday — is the highest Monday in the window and above the airport's own September Mondays (253–303), with 83 under airline flight numbers, just below the pre-storm 87–94, and 47 flights with both ends at Pensacola, against 17 the previous Monday. The surplus on all four days is in private and local flying, which no test on this page is built to attribute, and we do not. The airport's 1–6 October low run (111–180 a day) was over before Isaias could have mattered — its cause is not established, and we do not fold it into this storm. All counts are ADS-B observations from a crowdsourced receiver network: a floor on real traffic, not an official total, and the newest days can still rise as late records arrive.
What we watch next, and what would change this page. Until this page closed on 13 November, the detection layer re-checked every cycle: observed traffic at Pensacola and New Orleans against their own reference levels — above all where the airport settles after two surplus days (14 October 384, +47%, and 15 October 369, +41%), three days back inside its range (16 October 301, +15%, 17 October 158, −39%, and 18 October 238, −9%), six days above the reference again (19 October 317, +21%, 20 October 359, +38%, 21 October 360, +38%, 22 October 381, +46%, 23 October 343, +31%, and 24 October 298, +14%), a Sunday back at the reference (25 October 263, +1%, settled) and five days above it again (26 October 312, +20%, 27 October 355, +36%, 28 October 335, +28%, and 29 October 373, +43%, all settled, and 30 October 287, +10%, final without its third pass), and a Saturday below it (31 October 237, −9%, settled), then two days well below it on a thin feed (1 November 99, −62%, and 2 November 158, −39%, both settled) and a third and a fourth on a fuller feed (3 November 149, −43%, final without its third pass, and 4 November 141, −46%, settled), none of which we attribute, then a Thursday back inside the airport's own September range (5 November 213, −18%, settled) and a Friday to a Monday above it again (6 November 358, +37%, 7 November 324, +24%, and 8 November 355, +36%, all settled, and 9 November 335, +28%, final without its third pass — the nightly batches of 12 and 13 November failed feed-wide), surplus days we do not attribute either; the advisory track, on which nothing has been issued since 15:00 UTC on 11 October (the feed's most recent advisory, for another storm, is from 15:00 UTC on 12 November); and the SIGMET set over the Jacksonville and Houston FIRs. A dip will be attributed to the storm only if it falls on the days the storm was close enough to matter and goes deeper than the airport's own recent swings — and Pensacola's own early-October run has shown how deep those can be. This page and the PNS brief update from the same data. Whether flights operate on any given day is decided by the airports, the airlines and the relevant authorities.
What the data showed. This page is closed as of 13 November 2026, 12:50 UTC. No NHC advisory for Isaias has been issued since 15:00 UTC on 11 October, the last SIGMET tied to the storm expired at 09:55 UTC on 10 October, and none of the four FIRs on this page (KZHU, KZMA, KZJX, MMFR) has carried a notice tied to it since — our SIGMET ingest is current to 12:36 UTC on 13 November. The storm's measured effect on Pensacola was four days long: 54 movements on 9 October (−79%), 0 on 10 October (−100%), 6 on 11 October (−98%) and 22 on 12 October (−92%) — together about 960 movements below the ~261/day reference. 13 October read 151 (−42%), with the airport's normal daytime shape back. Recovery: the 27 days from 14 October to 9 November averaged 289 movements a day, +11% against the reference, with 19 of the 27 at or above it. Movements under airline flight numbers read 84, 84, 90 and 83 on 6–9 November, around the pre-storm 87–94. The low run of 1–4 November (99 to 158, −39% to −62%) came three weeks after the storm and is not attributed to it; the surplus days are in private and local flying and are not attributed either. Gap days: 9 November (335, +28%) is final without its third nightly pass, and 10–12 November are not readable — the nightly batches of 12 and 13 November failed feed-wide, leaving about 16,000–18,000 departures a day against about 131,000–146,000 on 2–9 November — so they are not plotted. All counts are ADS-B-observed movements from a crowdsourced receiver network, a coverage floor rather than an official total; the storm track is from NHC public advisories (storm al092026). Whether flights operate on any given day is decided by the airports, the airlines and the relevant authorities.
Passenger questions, answered from the data
As of 13 November 2026, 12:50 UTC, when this page closed, they were, on four days: Pensacola read 54 movements on 9 October (−79%, none logged after 15:28 UTC), 0 movements on 10 October (−100%), the day the storm's centre passed about 66 km to the east, 6 movements on 11 October (−98%), when the first airline flights since the storm were logged from 12:43 UTC, and 22 on 12 October (−92%), all before 14:00 UTC; 8 October read 226, inside the airport's normal range. 13 October read 151 (−42%), with the normal daytime shape back and 63 airline-flight-number movements against 87–94 before the storm — recovery under way, inside the airport's own early-October range. 14 October read 384 (+47%), the airport's highest day in the 60 days we hold, with 95 airline-flight-number movements, level with the pre-storm count, and 15 October 369 (+41%), now the fourth-highest. 16 October settled at 301 (+15%), back inside the airport's own September range. 17 October settled at 158 (−39%), a Saturday, with 99 airline-flight-number movements — above the pre-storm 87–94 — and the drop from the surplus days entirely in private and local flying. 18 October settled at 238 (−9%), a Sunday, with 83 airline-flight-number movements — just below the pre-storm 87–94 — inside the airport's own September Sunday range. 19 October settled at 317 (+21%), a Monday, and 20 October at 359 (+38%), a Tuesday, with 91 airline-flight-number movements inside the pre-storm range; 21 October settled at 360 (+38%), a Wednesday, with 87 airline-flight-number movements, 22 October at 381 (+46%), a Thursday, the second-highest day in the 60 days we hold, with 92, 23 October at 343 (+31%), a Friday, with 89, and 24 October at 298 (+14%), a Saturday, with 95; 25 October settled at 263 (+1%), a Sunday, with 97, within one per cent of the reference and inside its own September Sunday range; 26 October settled at 312 (+20%), a Monday, with 91 and the surplus in private and local flying, 27 October at 355 (+36%), a Tuesday, with 98, 28 October at 335 (+28%), a Wednesday, with 92, and 29 October at 373 (+43%), a Thursday, the third-highest day in 60 days, with 90; 30 October reads 287 (+10%), a Friday, with 92, inside its own September Friday range. 31 October settled at 237 (−9%), a Saturday, with 87, inside its own September Saturday range. 1 November settled at 99 (−62%), a Sunday, with 61, and 2 November at 158 (−39%), a Monday, with 72 — both below its own September range for the weekday, on two days when the feed reads thin at US airports of Pensacola's size — and 3 November reads 149 (−43%), a Tuesday, with 68, and 4 November settled at 141 (−46%), a Wednesday, with 81, both below its own September range for the weekday on days when the neighbouring airports read far closer to normal; all four fall more than three weeks after landfall, and we do not attribute them to the storm. 5 November settled at 213 (−18%), a Thursday, with 86, back inside its own September Thursday range; 6 November settled at 358 (+37%), a Friday, and 7 November settled at 324 (+24%), a Saturday — both above its own September range for the weekday; 8 November settled at 355 (+36%), a Sunday, the highest Sunday in the window, and 9 November reads 335 (+28%), a Monday, final without its third pass, the highest Monday in the window — with the surplus on all four days in private and local flying, which we do not attribute to the storm. Check your airline's status on the day of travel.
Pensacola read 111–180 observed movements a day on 1–6 October, against a ~261/day reference. That run started five days before Isaias formed and is not attributed to the storm. Our feed was collecting normally on those days, Mobile read low on 2–4 October too, and New Orleans and Birmingham did not. It was mostly repeat local flying that dropped out; from this feed alone we cannot tell whether that reflects fewer flights or thinner low-level receiver coverage. 7 October was back at 282.
It peaked at 105 kt, Category-3-equivalent, with a central pressure of 958–959 mb, from 12:20 to 20:00 UTC on 9 October (NHC). It was 90 kt — Category-2-equivalent — when NHC positions put the centre on the Florida Panhandle coast at 01:30 UTC on 10 October, post-tropical at 55 kt by 06:00 UTC and a 30 kt low over central Alabama by 09:00 UTC. Thunderstorm tops in the tropical-cyclone SIGMETs reached FL590.
Aircraft do not fly through hurricanes — dispatchers route around them, and airports inside the wind field pause operations under crosswind and gust limits set by regulators and manufacturers, then reopen after the wind drops and the field is inspected. We publish the measured operational picture: the advisory track, the distances, the airspace signals, the airport weather and the observed traffic. Routing, reopening and go/no-go decisions belong to airlines, airports and the relevant authorities.
For media — the full kit
Everything on this page — charts, CSV, quotes — is published under CC BY 4.0: free to reuse with attribution to FlySafe.zone. Charts come in dark (social/web) and light (print/light layouts) versions; attribution and license are embedded in every file.
“Hurricane Isaias peaked at 105 knots, a Category-3-equivalent major hurricane, on 9 October and was at 90 knots when NHC positions put its centre on the Florida Panhandle coast at 01:30 UTC on 10 October, about 66 km east of Pensacola International, where observations recorded a peak gust of 80 knots; it weakened to a 30-knot post-tropical low over Alabama within hours, and the convective SIGMETs tied to it lapsed at 09:55 UTC. Pensacola's observed traffic fell to 54 movements on 9 October, 79% below its normal level, with none logged after 15:28 UTC as the wind field arrived, to 0 movements on 10 October, 100% below normal, the day the centre crossed the coast, to 6 movements on 11 October, 98% below normal, when the first airline flights since the storm were logged from 12:43 UTC, and to 22 on 12 October, 92% below normal; 13 October read 151 movements, 42% below normal, with the airport's normal daytime pattern back, 14 October 384, 47% above it, 15 October 369, 41% above it, 16 October 301, 15% above it, 17 October 158, 39% below it, a Saturday with the airline count above pre-storm levels, 18 October 238, 9% below it, a Sunday with the airline count just below the pre-storm range, 19 October 317, 21% above it, 20 October 359, 38% above it, a Tuesday with the airline count inside the pre-storm range and the surplus in private and local flying, 21 October 360, 38% above it, 22 October 381, 46% above it, a Thursday and the second-highest day in 60 days, 23 October 343, 31% above it, 24 October 298, 14% above it, a Saturday, 25 October 263, 1% above it, a Sunday, 26 October 312, 20% above it, a Monday, 27 October 355, 36% above it, a Tuesday, 28 October 335, 28% above it, a Wednesday, 29 October 373, 43% above it, a Thursday and the third-highest day in 60 days, 30 October 287, 10% above it, a Friday, 31 October 237, 9% below it, a Saturday inside the airport's own September Saturday range, 1 November 99, 62% below it, and 2 November 158, 39% below it — two days on which the feed read thin at US airports of Pensacola's size — and 3 November 149 and 4 November 141, 43% and 46% below it, while neighbouring airports read far closer to normal; none of the four is attributed to the storm; 5 November read 213, 18% below it, back inside the airport's own September range for a Thursday; 6 November read 358, 37% above it, 7 November 324, 24% above it, 8 November 355, 36% above it, and 9 November 335, 28% above it on a count that never got its third pass, all four above the airport's own September range for the weekday and not attributed to the storm, according to flight-monitoring service FlySafe.zone.”
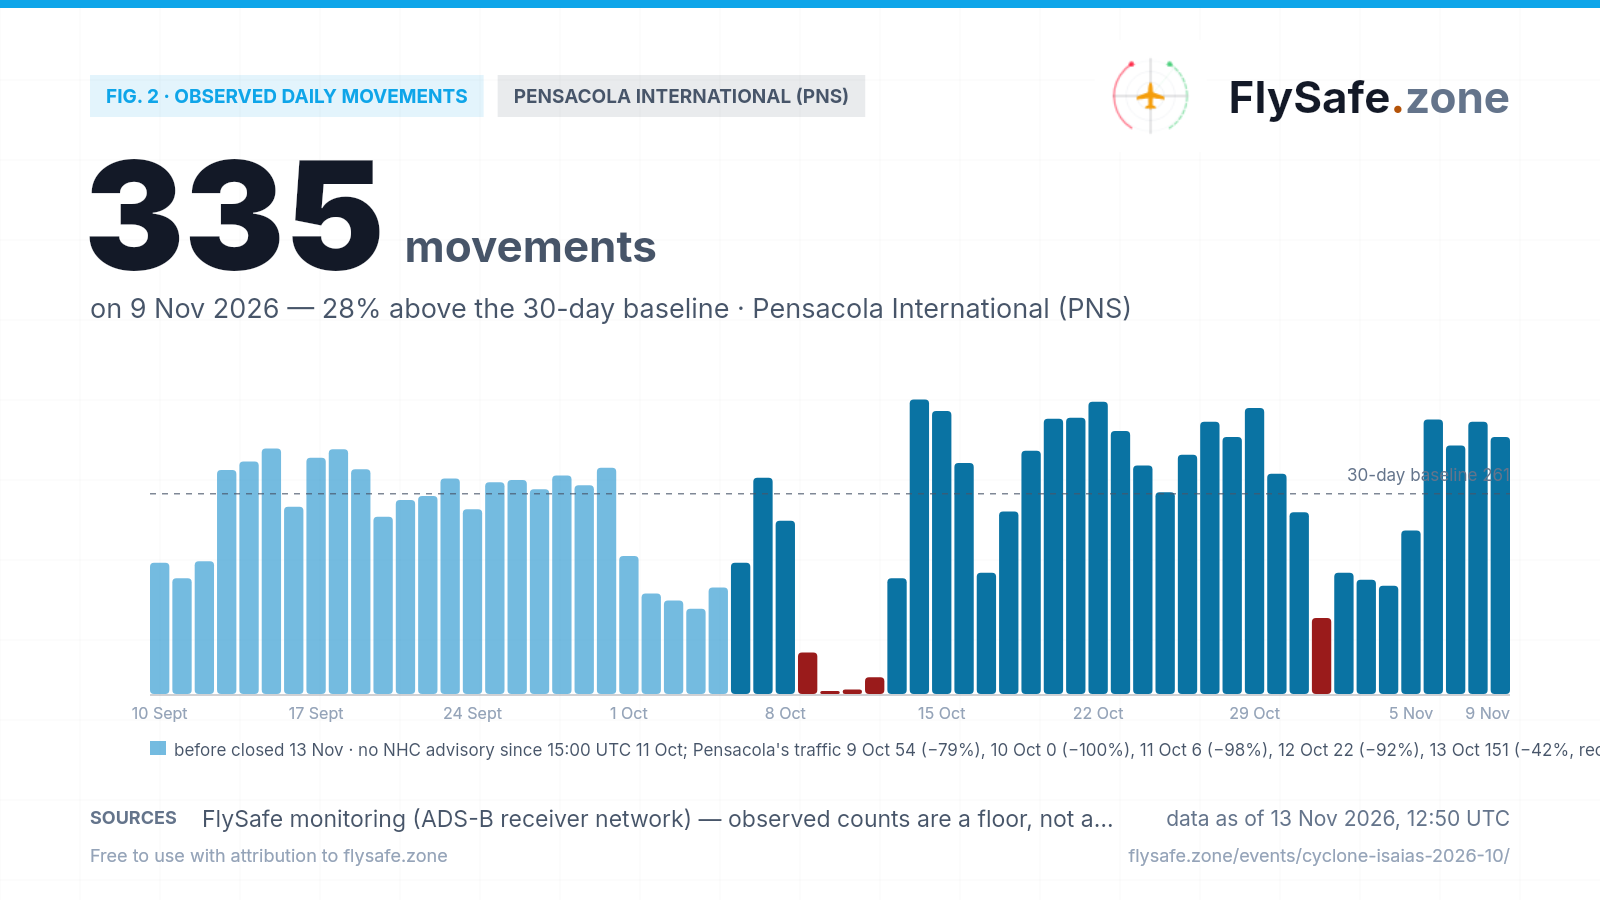
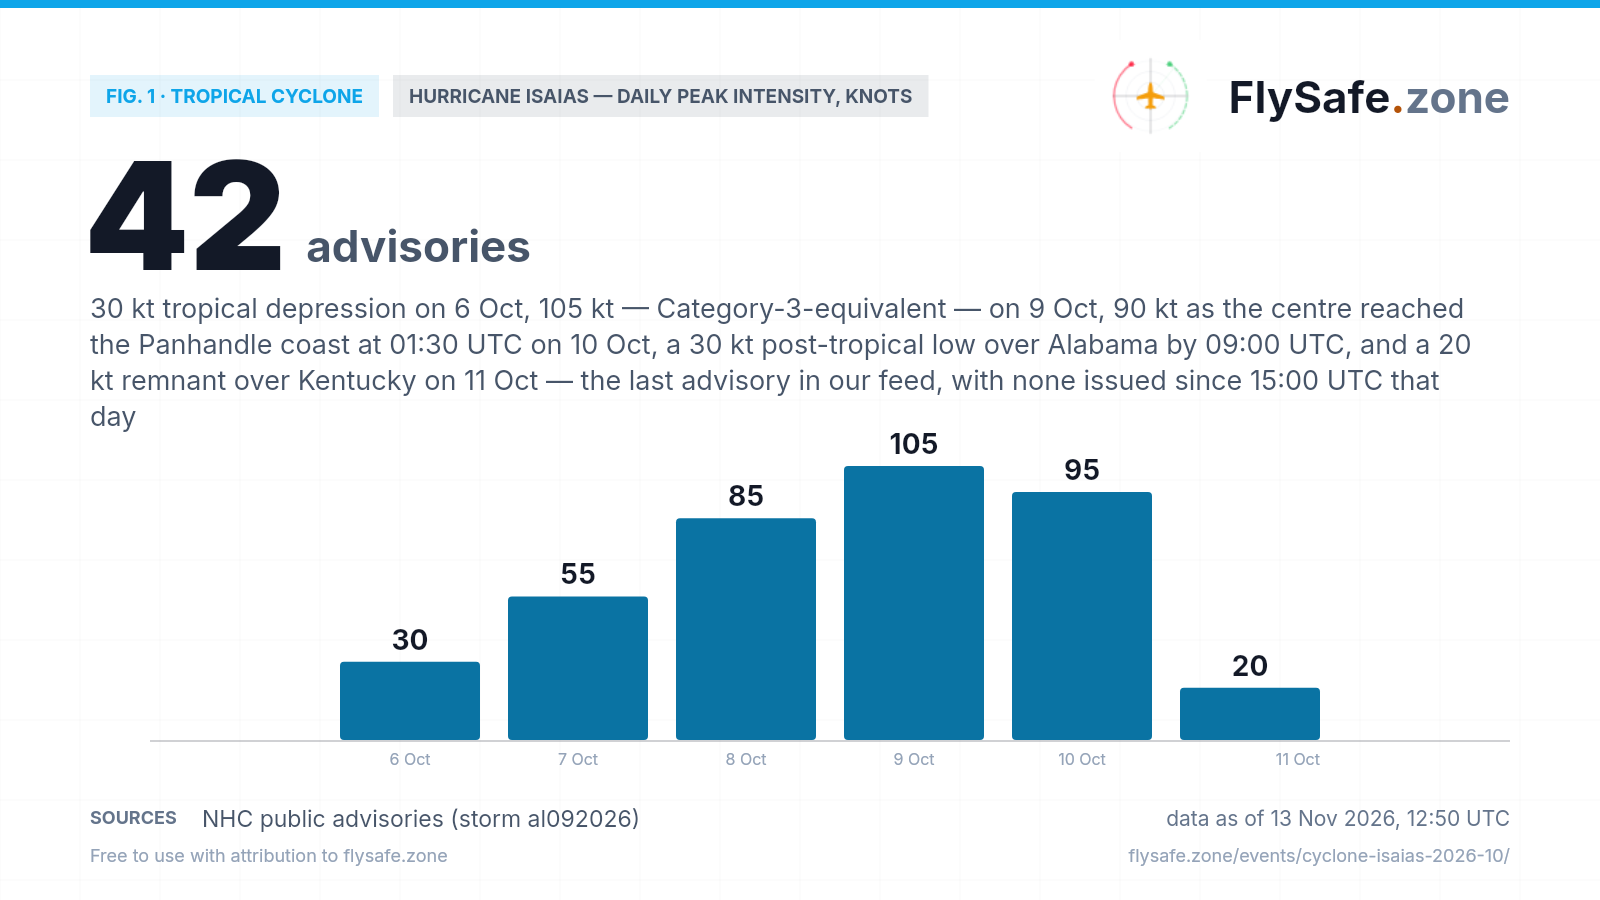
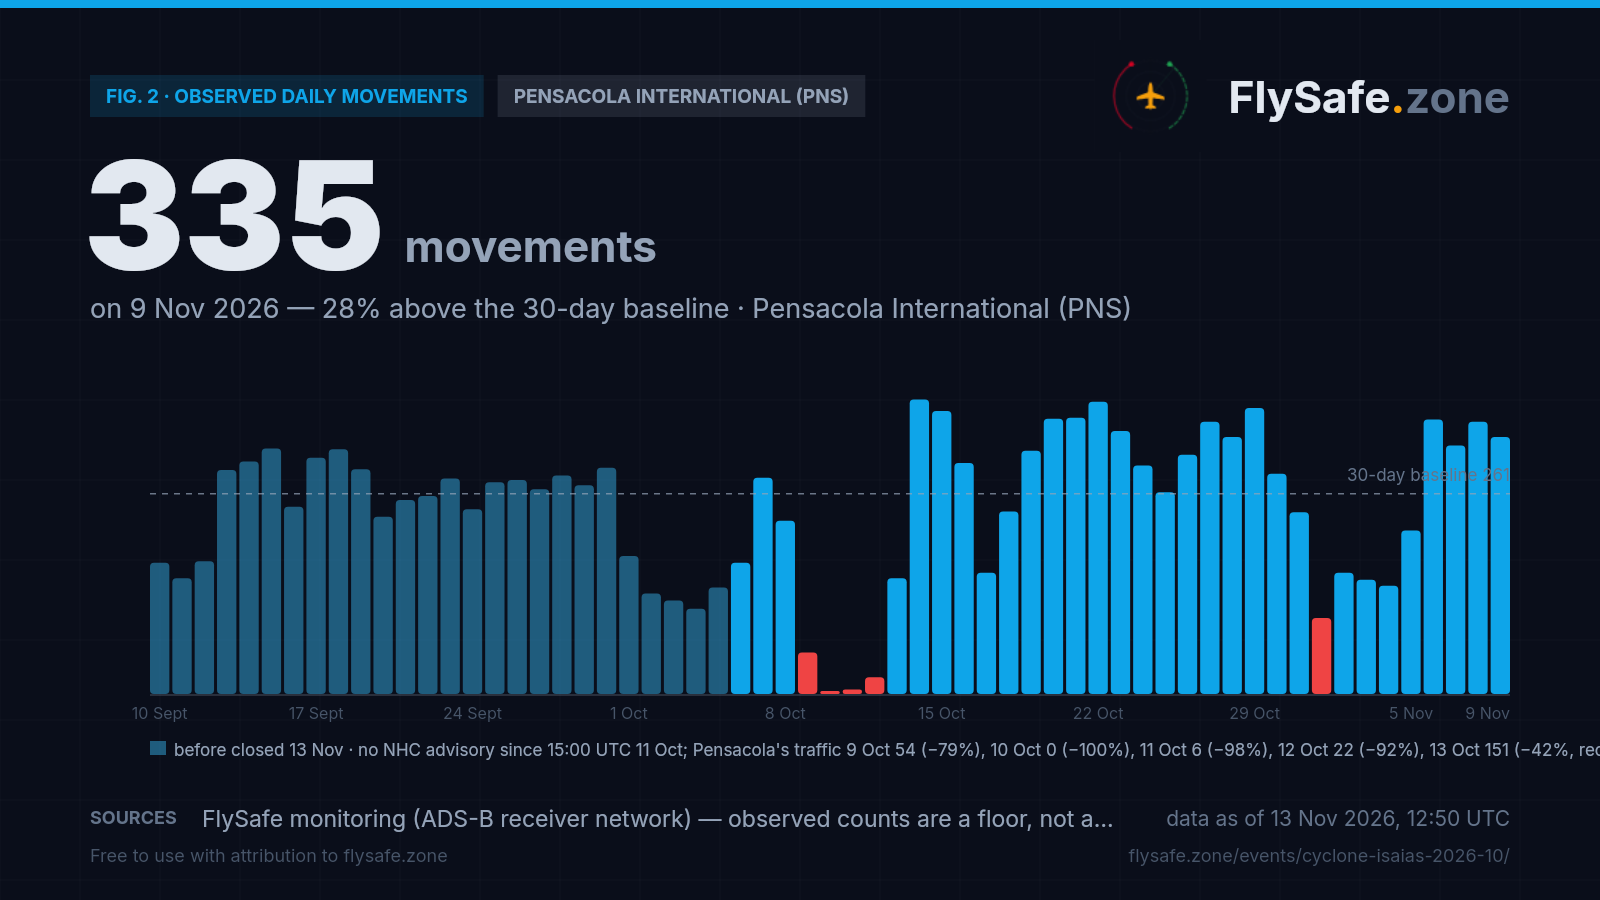
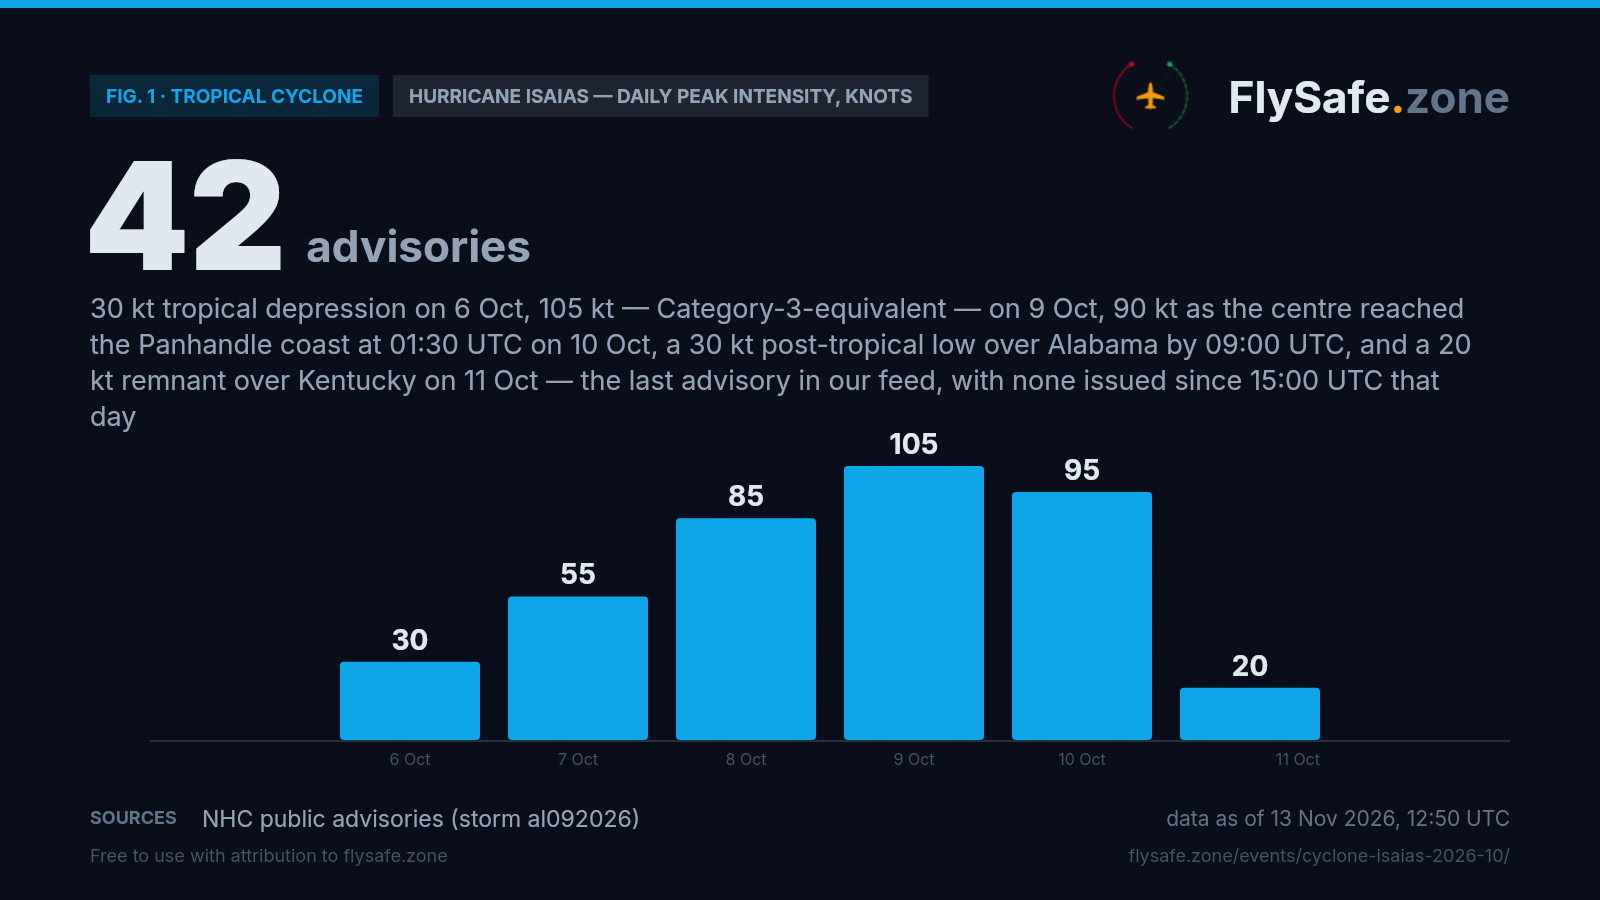
Boilerplate — about the source (for your article footer)
FlySafe.zone monitors airspace risk and observed airport activity worldwide: 334 flight-information regions scored daily, GPS-interference signals, volcanic-ash exposure and daily observed movements at 493 airports from the crowdsourced ADS-B receiver network. Methodology: flysafe.zone/methodology.
Need a different cut of the data, a comment, or numbers for another airport? Leave an email — we answer fast during active events.