Mumbai (BOM) Traffic ‘Drop’ of −67% on Thursday 15 October 2026 — the Airport Vanished From Our Feed at 07:00 UTC, and We Cannot Measure It
- The −67% ‘drop’ at Mumbai on Thursday 15 October is a measurement that stopped at 07:00 UTC, not a day of light traffic: 168 observed movements, all in the first seven hours (99% of the norm for that stretch), then nothing — through the rest of the day and every day from 16 to 21 October — while other Indian airports kept counting normally. Records came back at about 06:30 UTC on 22 October at the hourly rate of the week before (411 movements from 07:00 UTC to midnight against ~410), and the first complete day back, 23 October, settled at 570 — 98% of the ~580 baseline, and 24 October at 514. On 25 October the airport’s records thinned again from about 04:00 UTC — settled at 132, then 50, 25, 79, 78, 52 and 65 on 26–31 October, Goa and Pune with it — but departures climbing out of Mumbai kept being heard at close to their usual rate, so this second hole is partial; reported as measured, not attributed. On 1 November the airport’s records came back at the evening rate from 15:00 UTC, and on 2 November for the morning, thinning again from 14:00 UTC (both settled); 3 November is final and thin through the day, and 4 November has settled at 449 — counted through the day, still under the pre-gap range, departures short in the evening, not plotted — while the second ADS-B aggregate was back at its pre-gap level; on 5 November the airport’s evening came back from 18:00 UTC (settled at 198, not plotted), and 6 November has settled at 553 — 95% of the ~580 baseline, counted in every hour, the first complete day near it since 24 October, plotted; 7 November has settled at 635, plotted; on 8 November the airport’s records thinned a third time (settled at 235, not plotted); 9 November is final at 337 on two of three ingest nights, and 10 to 14 November, whose second ingest nights came in almost empty across our whole feed, were filled by a catch-up batch on 17 November and are final at 609, 676, 736, 766 and 714 — complete days, 105–132% of the ~580 baseline, plotted, their departures above the pre-gap range while those our records place at Juhu fell, which we report and do not attribute. Ahmedabad’s records stopped at 08:00 UTC on 1 November, came back from 13:00 UTC on 3 November, stopped again at 05:36 UTC on 5 November and came back from 07:16 UTC on 9 November.
- Most of what surrounds the hole points to lost receiver coverage: Mumbai-bound callsigns made 88 departures toward the airport after 07:00, against 95–99 on the days before (75, 74, 61, 77, 79 and 84 on 16–21 October with all three ingest nights in — a shortfall a control test at Bengaluru and Delhi does not show, which we report and do not attribute), Pune dropped out of the feed at the same hour, the Mumbai cell of the aircraft-telemetry grid halved while interior cells held, and a second ADS-B aggregate that shares receivers with ours lost Mumbai too.
- What we could not do for seven days is see Mumbai: from inside a coverage hole a quiet airport and a busy one look the same, so this page carries an amber ‘measurement gap’, not a verdict on those days — the return on 22 October came back as a step, the way receivers do, not a ramp, and the first complete days after it came in on the baseline; the second thinning from 25 October is reported, not read, on 6 and 7 November complete days came back at 553 and 635, on the baseline, and on 8 November the airport’s records thinned a third time. No closure notice for the airport — three low-confidence automated closure flags for the FIR rest on our own traffic counts — no weather break, GNSS at its floor; the closure-notice set did not refresh between 4 and 27 October. For a specific flight, check your airline as always.
Advisory timeline — how active is this episode
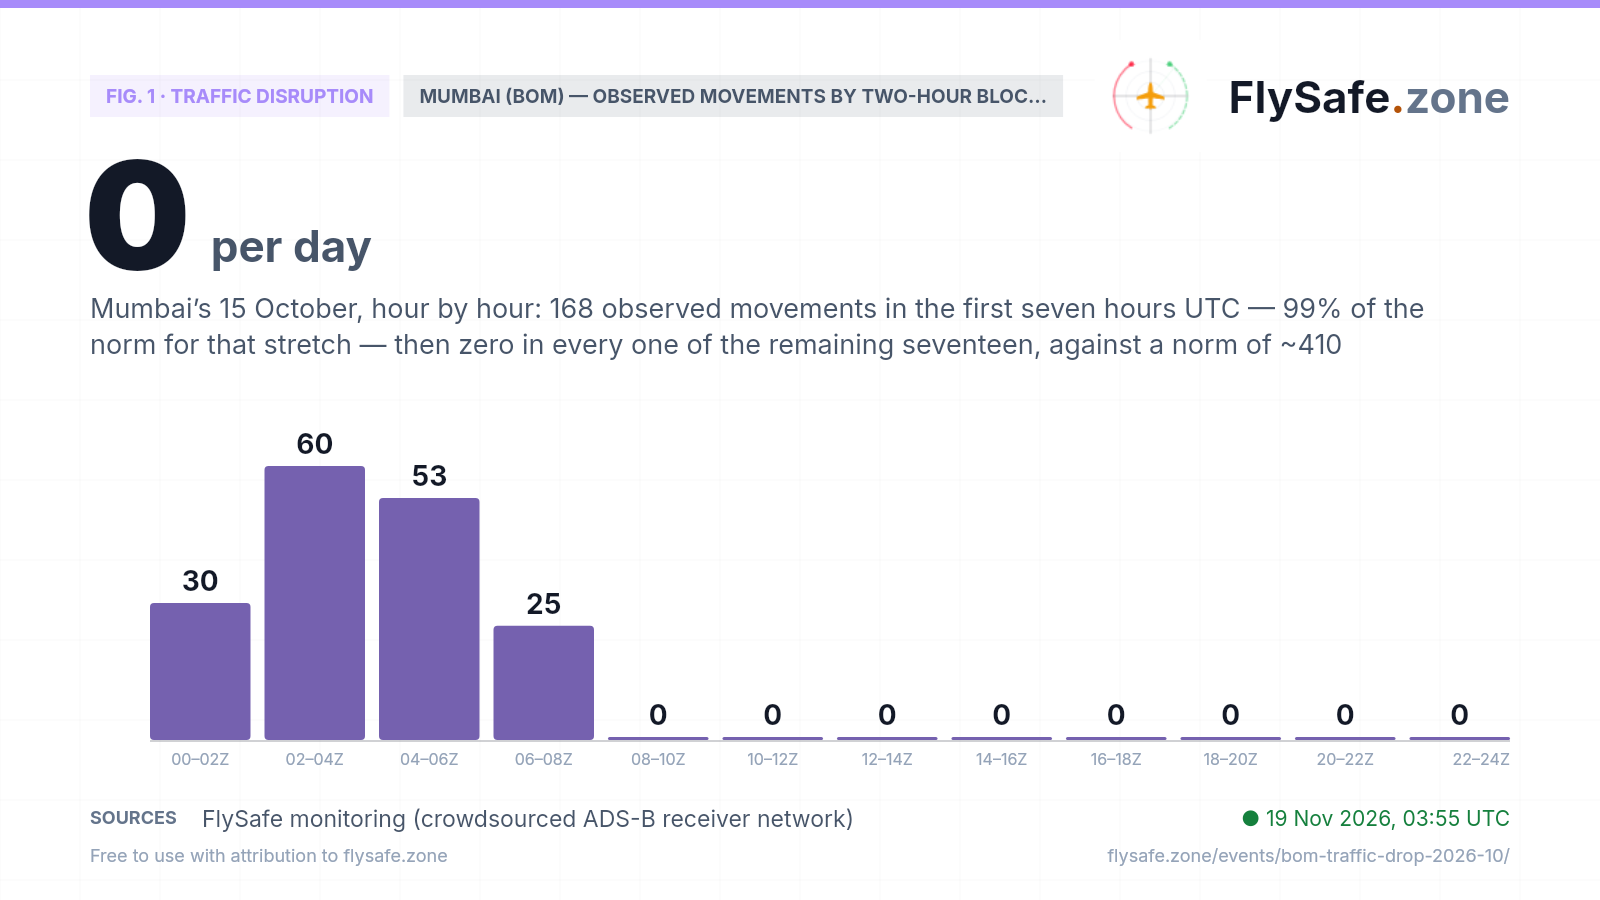
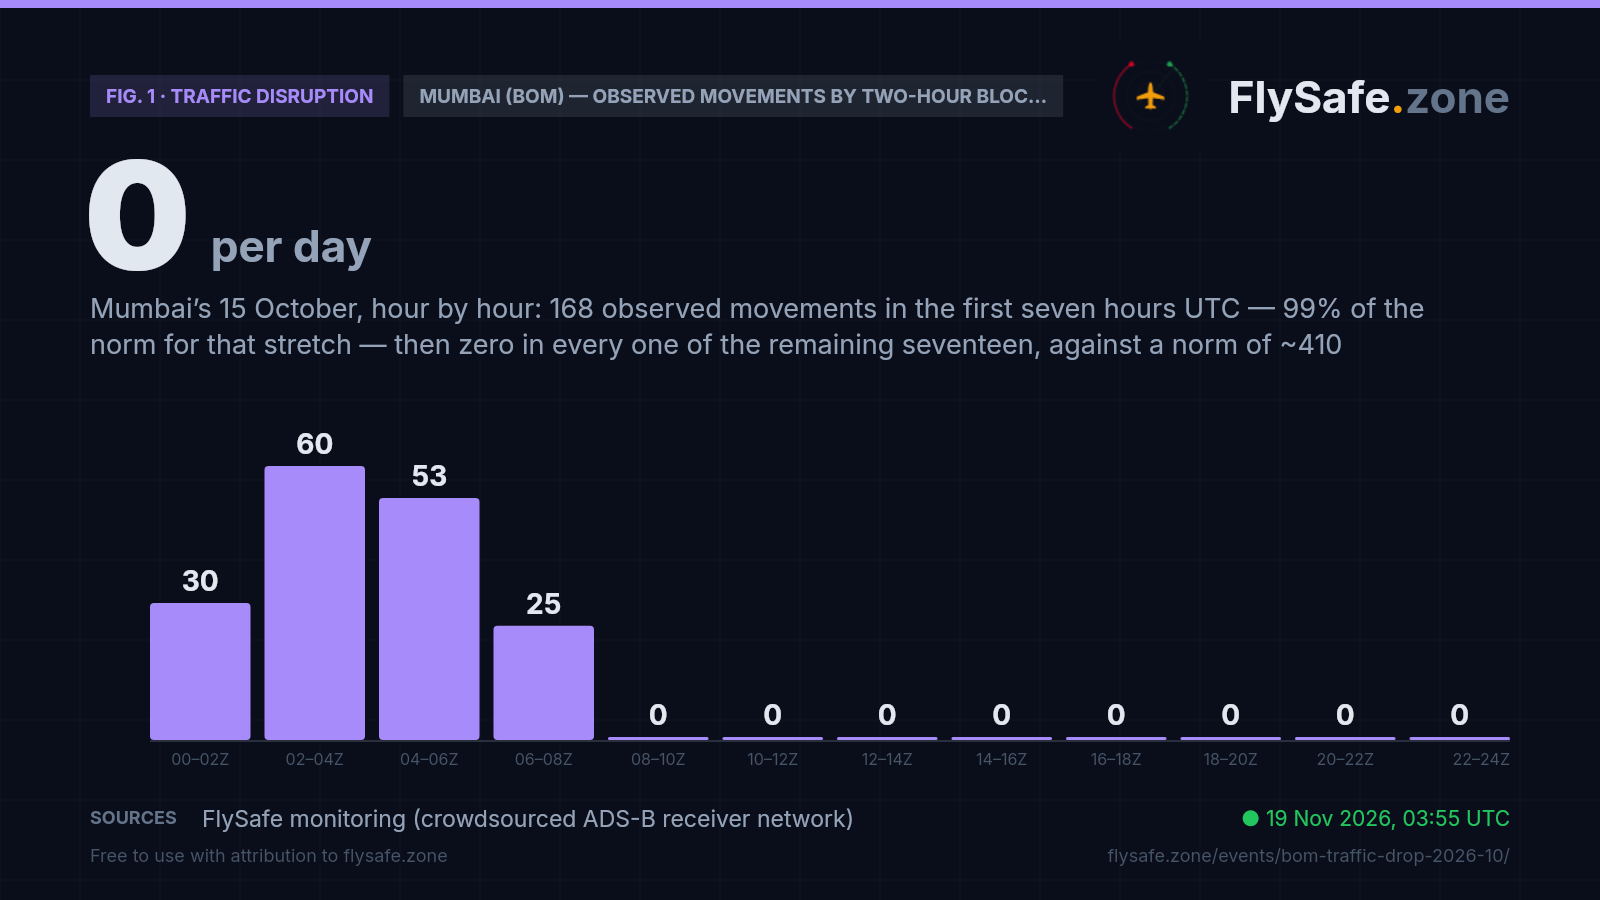
A quiet day and a dead feed look the same in a daily total; they look nothing alike hour by hour. Across 8–14 October Mumbai’s observed traffic in our feed ran at a steady 20–33 movements an hour from 01:00 to 20:00 UTC, about 580 a day. On Thursday 15 October the first seven hours delivered 10 / 20 / 25 / 35 / 22 / 31 / 25 — 168 movements, against 170 for the same hours the week before. The last departure record is stamped 06:51 UTC, the last arrival 06:59 UTC, and then nothing: not one movement in any of the remaining seventeen hours, where the week before had ~410, and not one on any day from 16 to 21 October; records reappear from about 06:30 UTC on 22 October. Delhi, Bengaluru, Chennai and Ahmedabad kept counting through the same hours on their usual rhythm. Two-hour blocks, UTC:
Fig. 1 — Observed departures + arrivals at Mumbai (BOM) in each two-hour UTC block of Thursday 15 October 2026; the 8–14 October average for the same blocks is 33 / 49 / 59 / 58 / 61 / 64 / 60 / 57 / 49 / 42 / 23 / 26 · Data as of 18 Nov 2026, 00:55 UTC · Source: FlySafe monitoring (crowdsourced ADS-B receiver network).
Airports in the exposure zone
| Airport | Size | Observed signal | FIR |
|---|---|---|---|
| Mumbai Chhatrapati Shivaji Maharaj International (BOM) | large | — · Thu 15 Oct: 168 observed (89 dep / 79 arr), all before 07:00 UTC · last records 06:51 / 06:59 UTC · 0 records for 16–21 Oct after all three ingest nights · records back from 06:57 UTC on 22 Oct: 423 (149 dep / 274 arr), 411 for 07–24 UTC vs a ~410 norm, partial day, not plotted · Fri 23 Oct: 570 (239 dep / 331 arr), settled, 98% of baseline · Sat 24 Oct: 514 (175 / 339), settled · Sun 25 Oct: 132 (77 / 55), settled, thinning from ~04:00 UTC, not plotted · Mon 26 Oct: 50 (36 / 14), settled, not plotted · Tue 27 Oct: 25 (20 / 5), settled, not plotted · Wed 28 Oct: 79 (74 / 5), settled, not plotted · Thu 29 Oct: 78 (57 / 21), settled, not plotted · Fri 30 Oct: 52 (27 / 25), two of three nights (third skipped feed-wide), not plotted · Sat 31 Oct: 65 (36 / 29), settled, not plotted · Sun 1 Nov: 244 (91 / 153), settled, thin to 15:00 UTC, then 199 for 15–24 UTC vs 169 on Sun 11 Oct, not plotted · Mon 2 Nov: 376 (112 / 264), settled, 287 for 00–14 UTC (347–441 on 5–14 Oct), thin from 14:00 UTC (89 vs 124–233), not plotted · Tue 3 Nov: 166 (43 / 123), final on two nights (third skipped feed-wide; 481–624 at that stage), thin all day, not plotted · Wed 4 Nov: 449 (164 / 285), settled, records in every hour UTC, 77% of baseline, arrivals in range, departures short (7 after 18:00 UTC), not plotted · Thu 5 Nov: 198 (89 / 109), settled, thin to 18:00 UTC, then 95 for 18–24 UTC vs ~91, not plotted · Fri 6 Nov: 553 (217 / 336), settled, every hour UTC counted, 95% of baseline, plotted · Sat 7 Nov: 635 (328 / 307), settled, every hour UTC counted, 109% of baseline, plotted · Sun 8 Nov: 235 (131 / 104), settled, thin from ~04:00 UTC — a third thinning, not plotted · Mon 9 Nov: 337 (132 / 205), final on two nights — third almost empty feed-wide (481–624 at that stage), thin to 08:00 UTC, not plotted · Tue 10 Nov: 609 (321 / 288), final — second night almost empty feed-wide, filled by the 17 Nov catch-up batch — every two-hour block counted, 105% of baseline, plotted · Wed 11 Nov: 676 (352 / 324), final, filled the same way, 117% of baseline, plotted · Thu 12 Nov: 736 (379 / 357), final, filled the same way, 127% of baseline, plotted · Fri 13 Nov: 766 (421 / 345), final, filled the same way, 132% of baseline, plotted · Sat 14 Nov: 714 (394 / 320), final, filled the same way, 123% of baseline, plotted · Sun 15 Nov: 716 (367 / 349) after two nights, not plotted yet · Mon 16 Nov: 508 (280 / 228) after one night · departures our records place at Juhu (mostly Mumbai airline services): 238 / 232 / 213 / 208 / 201 / 222 on 25 / 26 / 27 / 28 / 29 / 31 Oct (settled), vs 216–278 on 8–14 Oct; 217 on 30 Oct (two nights); 206 / 254 on 1 / 2 Nov (settled); 232 on 3 Nov (final, two nights), 214 / 220 on 4 / 5 Nov (settled), 202 on 6 Nov (settled), 119 / 164 on 7 / 8 Nov (settled), 168 on 9 Nov, final on two (210–271 at that stage); 113 / 69 / 87 / 81 / 76 on 10–14 Nov (final) · 8–14 Oct 575 / 633 / 490 / 556 / 603 / 607 / 596 (mean ~580) · second aggregate 183 vs 861–912 (1–11 Oct), no row for 16–21 Oct, 494 on 22 Oct, 796 on 23 Oct, 862 on 24 Oct, 496 / 260 / 314 / 382 / 415 / 391 / 452 / 439 / 503 / 730 / 854 / 756 on 25 Oct–5 Nov, no row 6 Nov (missing feed-wide), 635 on 7 Nov, 299 on 8 Nov, 524 on 9 Nov, 819 / 862 / 876 / 892 / 899 / 819 on 10–15 Nov · Mumbai-bound callsigns: 88 departures toward BOM after 07:00 (95–99 on 12–14 Oct), none seen landing at Mumbai; 75 / 74 / 61 / 77 / 79 / 84 on 16–21 Oct, settled; 22 Oct: 90, 77 seen landing at Mumbai (settled); 23 Oct: 92, 77; 24 Oct: 83, 73 (settled) · test stops at 24 Oct: callsigns turned over with the winter timetable on 25 Oct | VABF |
| Pune International Airport (PNQ) | medium | 124 km · Thu 15 Oct: 6 observed vs ~17 a day (−65%), all before 07:00 UTC — same cutoff as Mumbai · second aggregate: 182–228 a day to 11 Oct, 109 on 12 Oct, 53 on 13 Oct, no row 14–22 Oct, 136 on 23 Oct, 183 on 24 Oct, 211 / 101 / 172 / 204 / 211 / 215 / 175 / 48 / 98 / 223 / 203 / 204 on 25 Oct–5 Nov, no row 6 Nov (missing feed-wide), 30 on 7 Nov, no row 8 Nov, 106 on 9 Nov, 194 / 192 / 198 / 202 / 173 / 211 on 10–15 Nov · our feed: 1 on Sun 25 Oct, settled (22–32 on 22–24 Oct), 0 on 26 Oct, 2 on 27 Oct, 0 on 28 Oct, 1 on 29 Oct and 1 on 31 Oct (settled), 0 on 30 Oct with two of three nights in, 8 on 1 Nov and 5 on 2 Nov (settled), 3 on 3 Nov (final, two nights), 10 on 4 Nov and 9 on 5 Nov (settled), 7 on 6 Nov (settled), 26 on 7 Nov and 1 on 8 Nov (settled), 6 on 9 Nov (final, two nights) | VABF |
| Goa Dabolim International Airport (GOI) | medium | 430 km · Thu 15 Oct: 70 observed vs ~93 a day (−25%), counting through the day — edge of the hole, not inside it · Sun 25 Oct: 19 vs 93–99 on 22–24 Oct, none after 08:14 UTC (settled) · 26–31 Oct: 0 (30 Oct two of three nights) · 1–9 Nov: 0 (9 Nov final on two of three nights) | VABF |
Distance alone does not determine impact — wind direction and the flight levels the ash reaches decide which airports and routes are affected on a given day. FIR = Flight Information Region.
What our monitoring shows: four weeks of 420–670 a day, a bar that is seven hours long, a week of gaps — then two whole days back, 570 and 514, a second thinning, whole days again on 6 and 7 November, a third thinning, then five whole days, 609–766, on 10–14 November
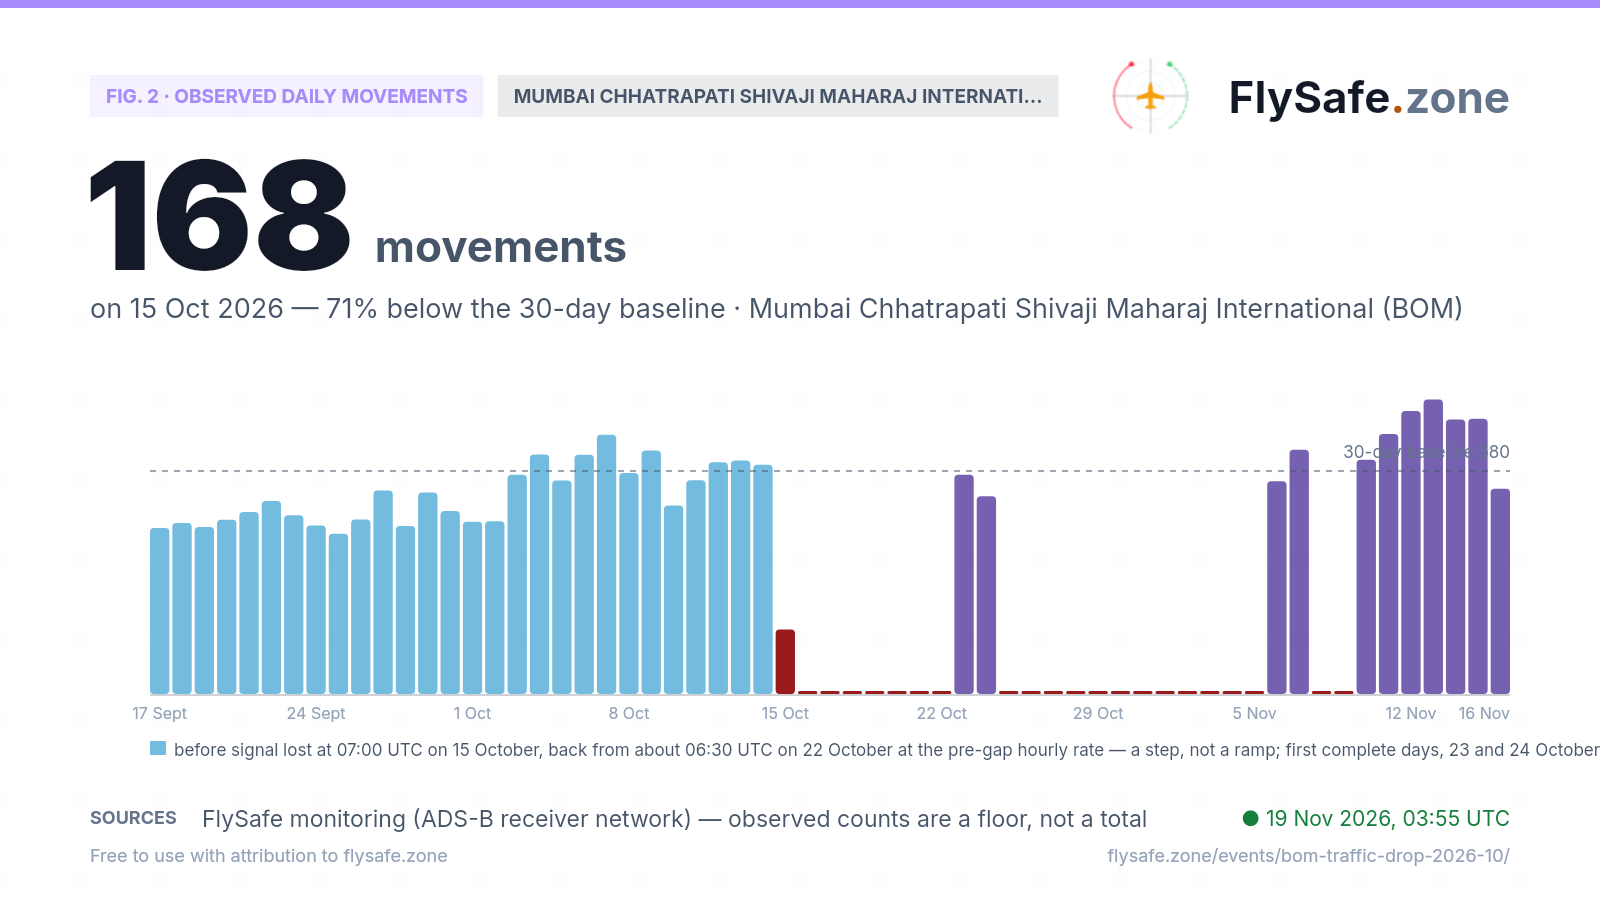
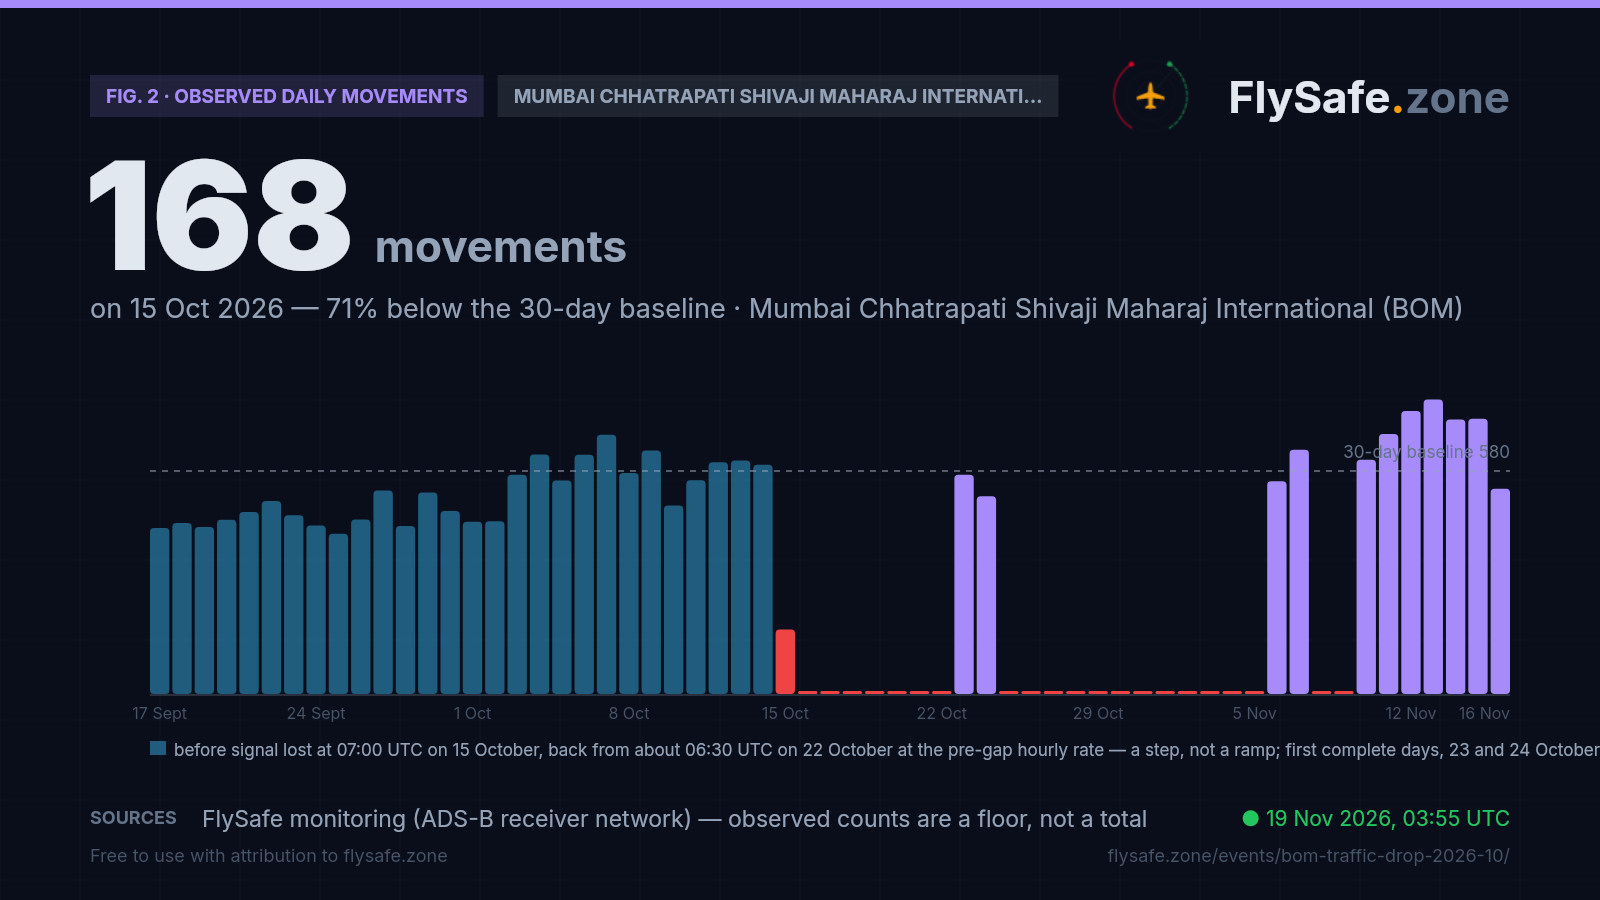
FlySafe tracks observed departures and arrivals at 493 airports from crowdsourced ADS-B receiver data. Observed counts are a floor, not a total — receiver coverage varies — but an airport measured against its own baseline is a reliable shape. Mumbai Chhatrapati Shivaji Maharaj International's last 30 days:
Fig. 2 — Observed daily movements at BOM, 17 Sept – 14 Nov (latest complete UTC day). Data as of 18 Nov 2026, 00:55 UTC · Source: FlySafe monitoring (ADS-B receiver network).
- 8–14 October: 575 / 633 / 490 / 556 / 603 / 607 / 596 observed movements a day, a mean of ~580 — the baseline we hold the flagged day to. The week before that ran 570–674; 17 September to 2 October ran lower, 417–529, on the departures side (see the coverage note below).
- Thursday 15 October: 168 observed movements (89 departures / 79 arrivals), −71% against the ~580 baseline, −67% against the ~511 seven-day rolling average the detection layer used (a window that includes the flagged day itself), −62% against the 448 same-weekday baseline our airport detector scored it on. This bar is not a day. It is the first seven hours of one: every movement in it is stamped before 07:00 UTC, those seven hours ran at 99% of their norm, and the remaining seventeen hours hold nothing at all.
- What tripped the flag: a daily total that was a quarter of the usual, at a large airport, with no gap-day marker — because the network as a whole collected normally that day (~102% of its 14-day median), so the day was not excluded. The arithmetic is right; the day it measured is not a whole day for Mumbai.
- The feed was gone for seven days. Our flight records land in two main overnight batches (for this airport, roughly 40% on the first night and 55% on the second, with a few percent on the third). All three nights have now run for 15 October — the second added 42 departure records, every one of them before 07:00 UTC, and the third added none for Mumbai, so 168 is final. All three nights have run for 16 October: 0 records for Mumbai, against 1,549 for Delhi, 723 for Bengaluru, 333 for Chennai and 255 for Ahmedabad — each inside or near its range for the week. All three nights have run for 17, 18, 19 and 20 October: 0 for Mumbai on each. All three nights have now run for 21 October: 0 for Mumbai again, against 879 departure records for Delhi (822 after the two main nights, when Bengaluru stood at 448, Chennai at 237 and Ahmedabad at 112). From 06:59 UTC on 15 October to the end of 21 October there is no record of any movement at Mumbai, Pune or Juhu. Every day from 16 to 21 October is plotted as a gap in the chart above, not as zero: they are not measurements.
- 22 October: the records came back — at the rate they left. The first records for 22 October are a Juhu departure at 06:30 UTC, a Mumbai departure at 06:57 UTC and a Pune arrival at 09:04 — within half an hour of a full week after the cutoff. With all three ingest nights in, Mumbai shows 423 observed movements (149 departures / 274 arrivals), every one from 06:57 on. Hour by hour from 07:00 UTC: 25 / 28 / 24 / 25 / 24 / 37 / 32 / 30 / 29 / 23 / 26 / 29 / 25 / 17 / 9 / 10 / 18 — 411 for 07:00–24:00, against ~410 for the same hours on 8–14 October. That is the edge on the way in that a coverage gap predicts: the first full hour back sits near its norm (25 against ~29), with no ramp. The arrivals side, the stable one for ten weeks before the gap, reads 274 against ~245 for those hours on a complete day. The second ADS-B aggregate has Mumbai rows again: 494 (284 departures / 210 arrivals) on 22 October, the day the records came back, 796 (436 / 360) on 23 October and 862 (435 / 427) on 24 October, against 861–912 a day on 1–11 October and 730–790 on 12–14 October, then 496 (255 / 241) on 25 October, 260 (195 / 65) on 26 October, 314 (230 / 84) on 27 October, 382 (315 / 67) on 28 October, 415 (268 / 147) on 29 October, 391 (251 / 140) on 30 October, 452 (229 / 223) on 31 October and 439 (265 / 174) on 1 November; its Pune row is back too (136 on 23 October, 183 on 24 October, 211 on 25 October, 101 on 26 October, 172 on 27 October, 204 on 28 October, 211 on 29 October, 215 on 30 October and 175 on 31 October, against 182–228 to 11 October), then fell to 48 on 1 November. 22 October is not plotted: its records begin at 06:57 UTC, so it is not a whole day, and the hole on the front of it would read as a drop that did not happen — the mirror image of 15 October. Friday 23 October, the first complete day back, has settled: 570 observed movements (239 departures / 331 arrivals) with all three ingest nights in — 98% of the ~580 baseline, inside the 490–633 range of 8–14 October. Its first seven hours UTC read 169 against a norm of 170, and 07:00–24:00 read 401 against ~410. It is plotted in the chart above. Saturday 24 October has settled too: 514 (175 / 339) with all three nights in, against 490 on Saturday 10 October — 89% of the ~580 baseline, inside the 490–633 range of 8–14 October, 7–32 movements in every hour UTC. It is plotted as the last bar.
- 25 October: the feed thinned again — at the airport itself. With all three ingest nights in, Sunday 25 October has settled at 132 observed movements at Mumbai (77 departures / 55 arrivals), against 490–633 on complete days. The first four hours UTC ran 19 / 32 / 25 / 17 — 93 against a norm of ~82 — and from 04:00 the count fell away: 7 / 1 / 9 / 2 / 3 / 3, then 0–3 an hour to midnight; the last departure record is stamped 16:40 UTC. That is a fade over an hour or two, not the single wall of 15 October. 26 October has settled at 50 (36 / 14), 27 October at 25 (20 / 5), 28 October at 79 (74 / 5) 29 October at 78 (57 / 21) and 31 October at 65 (36 / 29), each with all three ingest nights in, against 490–633 on the complete days of 8–14 October — 28 October’s departures up on 26 and 27 October (74 against 36 and 20), its arrivals still at 5, and 29 October’s arrivals up to 21 and 31 October’s to 29, against 331 and 339 on 23 and 24 October; 30 October reads 52 (27 / 25) with two of three in, against 481–624 at the same stage for each day of 8–14 October — its third ingest night was skipped across our whole feed, not for Mumbai alone, so that is as far as it fills. Goa thinned the same day — 19 observed movements on 25 October, none after 08:14 UTC, against 93–99 on 22–24 October, none on 26, 27, 28, 29 or 31 October (settled), none on 30 October, none on 1 or 2 November (settled), none on 3 November (final, two nights), none on 4, 5 or 6 November (settled) none on 7 or 8 November (settled) and none on 9 November (final, two nights) — and Pune logged 1 on 25 October, none on 26 October, 2 on 27 October, none on 28 October and 1 on 29 and 31 October (all settled), none on 30 October with two nights in, 8 on 1 November and 5 on 2 November (settled), 3 on 3 November (final, two nights), 10 on 4 November, 9 on 5 November and 7 on 6 November (settled), 26 on 7 November and 1 on 8 November (both settled) and 6 on 9 November (final, two nights; 22–32 on 22–24 October). This hole is not the one of 15–21 October. Our records place a steady stream of departures at Juhu, the general-aviation field 6 km from the main airport: 216–278 a day on 8–14 October, about 85% of them airline services — IndiGo, Air India, Akasa and Air India Express flights to Delhi, Bengaluru, Dubai and London — that Juhu does not handle, so in practice they are Mumbai departures attributed to the neighbouring field. In the first gap they vanished with everything else. This time they kept close to their rate: 238 on 25 October and 232 on 26 October (both settled), spread across the day with no break at 04:00, then 213 on Tuesday 27 October and 208 on Wednesday 28 October (both settled), just under the 216–278 of 8–14 October and around the 203 and 209 of Tuesday 6 and Wednesday 7 October, with departures in every hour from 00:00 to 22:00 UTC on 28 October, and 201 on Thursday 29 October (settled), the lowest of the five settled days since 25 October and 12% under the 228 of Thursday 8 October; 30 October reads 217 with two nights in (its third skipped feed-wide), inside the 210–271 at that stage on 8–14 October, and Saturday 31 October has settled at 222, inside the 216–278 of 8–14 October. On 27 October–1 November 83–89% of them were airline callsigns. Records attributed to Juhu also show 55 arrivals on 26 October, 30 on 27 October, 19 on 28 October, 26 on 29 October and 28 on 31 October (all settled), most of them airline flights, against 13–16 on 23–25 October, and 35 on 30 October with two nights in. Departures from Delhi, Bengaluru, Chennai, Ahmedabad, Kolkata and Dubai held at 2,586 on 25 October, 2,570 on 26 October, 2,506 on 27 October, 2,569 on 28 October, 2,611 on 29 October and 2,540 on 31 October (2,398–2,543 on 22–24 October; 2,644 on 30 October with two nights in), while those seen landing at Mumbai fell to 25, against 110–135, then to 8 on 26 October, 2 on 27 October, 2 on 28 October, 4 on 29 October and 6 on 31 October (all settled), and 8 on 30 October with two nights in — with the callsign test stopped, we cannot tell how many of the rest were bound for Mumbai. Delhi (1,595), Bengaluru (840), Chennai (340) and Ahmedabad (280) counted on or above their 22–24 October levels on 25 October, and again on 26–29 October (1,576 / 832 / 326 / 266, 1,548 / 834 / 417 / 259, 1,604 / 791 / 433 / 250 and 1,590 / 851 / 439 / 228, settled, then 1,608 / 838 / 460 / 262 on 30 October with two nights in), so the ingest nights themselves ran normally; on 31 October Delhi, Bengaluru and Chennai read 1,568 / 873 / 345 (settled) and Ahmedabad thinned to 157 (below). The second ADS-B aggregate read 496 for Mumbai on 25 October, 260 on 26 October, 314 on 27 October, 382 on 28 October, 415 on 29 October, 391 on 30 October and 452 on 31 October against 862 on 24 October — arrivals falling hardest there too (65, 84 and 67 on 26–28 October, then 147, 140 and 223 on 29–31 October, against 427) — and its Pune row read 211, 101, 172, 204, 211, 215 and 175; the Mumbai grid cell carried 373, 347, 350, 387, 388, 377 and 392 aircraft (432 on 24 October), not the 0–3 of the first gap. What we have is records thinning at the airport — arrivals most of all — while departures climbing out of Mumbai are still being heard. We report it as measured and do not attribute it; 25 October is not plotted, for the same reason 22 October is not: a day on which our records at the airport itself thin out after four hours is not a whole day, whatever its count. 26, 27, 28, 29 and 31 October, settled at 50, 25, 79, 78 and 65, and 30 October at 52, with our records at the airport thin from their first hour, are not plotted either.
- 1 November: Mumbai’s records came back for the evening. Sunday 1 November has settled at 244 observed movements at Mumbai (91 departures / 153 arrivals). Its first fifteen hours UTC ran as thin as the days before — 45 movements from 00:00 to 15:00 UTC — and from 15:00 UTC the count stepped up: 31 / 31 / 31 / 27 / 30 / 21 / 9 / 4 / 15 an hour to midnight, 199 (61 departures / 138 arrivals) for 15:00–24:00, against 169 on Sunday 11 October and 105–194 for those hours on 8–14 October. Monday 2 November ran the other way. With all three ingest nights in it has settled at 376 (112 / 264): its morning came back — 287 movements from 00:00 to 14:00 UTC, 13–28 an hour, against 347–441 for those hours on 5–14 October — and from 14:00 UTC the count thinned again, 89 (10 departures / 79 arrivals) to midnight against 124–233. Tuesday 3 November is final at 166 (43 / 123) with two of three ingest nights in — its third was skipped across our whole feed, as 30 October’s was — against 481–624 at that stage for each day of 8–14 October: 2–23 movements an hour, with no stretch back at the usual rate, thin through the day. Wednesday 4 November has settled at 449 (164 / 285) with all three ingest nights in — movements in every hour UTC, the fullest day at the airport since 24 October, but 77% of the ~580 baseline and under the 490–633 of the complete days of 8–14 October. Its arrivals, 285, sit inside the 273–371 of those days; its departures, 164, sit under their 213–279, with 7 from 18:00 UTC to midnight; and in two-hour blocks it ran 35 / 35 / 52 / 40 / 35 / 41 / 59 / 50 / 45 / 31 / 14 / 12 against 33 / 49 / 59 / 58 / 61 / 64 / 60 / 57 / 49 / 42 / 23 / 26, thinnest from 08:00 to 12:00 UTC (76 against ~125) and after 20:00. Thursday 5 November has settled at 198 (89 / 109) with all three ingest nights in: thin to 18:00 UTC — 103 movements in eighteen hours — and then 95 (27 departures / 68 arrivals) from 18:00 UTC to midnight, level with the ~91 those hours carried on a settled day of 8–14 October: the evening back, the shape of 1 November. Friday 6 November has settled at 553 (217 departures / 336 arrivals) with all three ingest nights in — 95% of the ~580 baseline, inside the 490–633 of the complete days of 8–14 October. Movements in every hour UTC, in two-hour blocks 60 / 74 / 43 / 49 / 36 / 36 / 38 / 37 / 72 / 55 / 31 / 22 against 33 / 49 / 59 / 58 / 61 / 64 / 60 / 57 / 49 / 42 / 23 / 26: fuller than the 8–14 October pattern to 04:00 UTC (134 against ~82) and from 16:00 to 20:00 UTC (127 against ~91), thinner from 08:00 to 16:00 UTC (147 against ~242). Its departures, 217, sit inside the 213–279 of settled 8–14 October days and its arrivals, 336, inside their 273–371. It is the first complete day near the baseline since 24 October, and it is plotted. Saturday 7 November has settled at 635 (328 departures / 307 arrivals) with all three ingest nights in — 109% of the ~580 baseline, just above the 490–633 of the complete days of 8–14 October. In two-hour blocks 52 / 58 / 46 / 57 / 62 / 68 / 61 / 68 / 56 / 51 / 38 / 18 against 33 / 49 / 59 / 58 / 61 / 64 / 60 / 57 / 49 / 42 / 23 / 26: fuller than the pattern to 04:00 UTC, a little under it from 04:00 to 08:00 UTC, at or above it from 08:00 to 22:00 UTC and under it after. Its arrivals, 307, sit inside the 273–371 of those days; its departures, 328, sit above their 213–279, while the departures our records place at Juhu settled at 119, against 216–278 — the Juhu-attributed stream thinned as the airport’s own departures rose, which we report and do not attribute. It is plotted: a second complete day back, on the baseline. Sunday 8 November: the records thinned a third time. With all three ingest nights in it has settled at 235 (131 / 104): its first four hours UTC ran 50 / 52 in two-hour blocks, 102 against ~82, and from 04:00 UTC the count fell away — 19 / 7 / 4 / 10 / 25 / 49 / 6 / 4 / 2 / 7, 133 in twenty hours against ~499. The second ADS-B aggregate’s Mumbai count fell the same day, to 299 (226 / 73) from 635 (415 / 220), it had no Pune row, and its grid cell east of Mumbai carried 31 aircraft against 170 the day before; Delhi, Bengaluru and Chennai read 1,383 / 779 / 243 against 1,556 / 850 / 299 on 7 November — lower too, not by the same order. It is not plotted: a day on which our records at the airport thin out after four hours is not a whole day, the rule of 25 October. Monday 9 November is final at 337 (132 / 205) with two of three ingest nights in — its third, on 12 November, came in almost empty across our whole feed (15 records for the day feed-wide, against ~5,000 on a third night) — against 481–624 at that stage: thin to 08:00 UTC (51 movements against ~199), 13–55 in each two-hour block after; the second aggregate read 524 (294 / 230) for Mumbai that day. It is not plotted, the rule of 25 October. 10–14 November: a catch-up batch filled the gap, and the days are whole. Their second ingest nights came in almost empty across our whole feed (3,207–3,569 records a day feed-wide, against 112,000–121,000 on a second night before); on 17 November a catch-up batch carried 106,000–128,000 records for each of 10–16 November, and 10–14 November are now final at 609 (321 / 288), 676 (352 / 324), 736 (379 / 357), 766 (421 / 345) and 714 (394 / 320) — counted in every two-hour block UTC, 105–132% of the ~580 baseline, and plotted. Our whole feed counted 145,000–147,000 records on each of 10–12 November, at the top of the 131,000–146,000 of 2–9 November. Arrivals at Mumbai sit inside the 273–371 of 8–14 October; departures sit above the 213–279 of those days, while those our records place at Juhu fell to 113 / 69 / 87 / 81 / 76 against 216–278 — the pattern of 7 November, which we report and do not attribute. Sunday 15 November reads 716 (367 / 349) with two of three ingest nights in and is not plotted until its third; Monday 16 November reads 508 after one. The second aggregate read 819 (411 / 408) for Mumbai on 10 November, 862 (442 / 420) on 11 November and 876 (448 / 428) on 12 November, 892 (462 / 430) on 13 November, 899 (467 / 432) on 14 November and 819 (419 / 400) on 15 November — back inside the 730–912 it counted there on 1–14 October. Departures from Delhi, Bengaluru, Chennai, Ahmedabad, Kolkata and Dubai seen landing at Mumbai rose to 57 on 1 November and 100 on 2 November (both settled), against 2–8 a day on 26–31 October and 110–135 on 22–24 October, then 50 on 3 November (final, two nights), 121 on 4 November (settled), level with the 110–135 of 22–24 October, 47 on 5 November (settled), 131 on 6 November (settled), level with the 110–135 of 22–24 October, 120 on 7 November and 35 on 8 November (both settled) and 81 on 9 November (final, two nights) and 114, 123, 136, 129 and 125 on 10–14 November (final), and records attributed to Juhu showed 206 and 254 departures on 1 and 2 November, settled, 232 on 3 November (final, two nights), 214 on 4 November (settled; 216–278 on 8–14 October, 86% of them airline callsigns), 220 on 5 November, 202 on 6 November, 119 on 7 November and 164 on 8 November (all settled) and 168 on 9 November (final, two nights; 210–271 at that stage on 8–14 October), then 113, 69, 87, 81 and 76 on 10–14 November (final). 1 November is not plotted: a day thin until 15:00 UTC is not a whole day, whatever its evening shows — the same rule as 22 October — and 2 November, thin from 14:00 UTC, and 3 November, thin through the day, are not plotted either. 4 November is the hard case, and we say how we decided it: every hour is counted and its arrivals are in range, so it may be a whole day that ran under the baseline — but its departures are short in the evening while the Mumbai departures our records place at Juhu held their rate, which is the signature of the partial hole of 25 October onward, and our records cannot separate the two readings. It is given here, not plotted; 5 November, settled but thin to 18:00 UTC, is not plotted either. Ahmedabad, which counted normally through 30 October, thinned on Saturday 31 October — 157 observed movements, settled, against 178–280 a day since 4 October — and on 1 November its records stopped at 08:00 UTC (71, settled), with 7 on 2 November (settled); they came back from 13:00 UTC on 3 November (104, final with two nights in) and ran through the whole of 4 November (228, settled, against 178–280 a day since 4 October), then stopped again at 05:36 UTC on 5 November (71, final), with none on 6, 7 or 8 November (settled), and came back from 07:16 UTC on 9 November (110, final with two nights in), while Delhi (1,580, 1,634, 1,605 and 1,610 on 1–4 November, final), Bengaluru (856, 839, 847 and 870) and Chennai (322, 429, 385 and 295) kept counting. The second ADS-B aggregate read 439 for Mumbai on 1 November and 48 for Pune, against 175 the day before, and 503 and 98 on 2 November, then 730 (355 / 375) and 223 on 3 November and 854 (430 / 424) and 203 on 4 November and 756 (417 / 339) and 204 on 5 November — back inside the 730–912 it counted at Mumbai on 1–14 October and the 182–228 at Pune to 11 October — and the Mumbai grid cell carried 446, 435 and 440 aircraft on 3, 4 and 5 November, against 404–444 the week before the gap. That aggregate has no row for 6 November at any airport — missing across its whole feed — and on 7 November it read 635 (415 / 220) at Mumbai and 30 at Pune, with the grid cell east of Mumbai down to 170 aircraft (372 in the Mumbai cell), while its Bengaluru and Chennai counts held (738 and 396); on 8 November it read 299 (226 / 73) at Mumbai, with no Pune row, and the grid cell east of Mumbai carried 31 aircraft (283 in the Mumbai cell), while Bengaluru and Chennai read 693 and 348; on 9 November it read 524 (294 / 230) at Mumbai and 106 at Pune, and on 10 November 819 (411 / 408) and 194 — both back inside their pre-gap ranges — with the two grid cells at 425 and 396 aircraft, then 862 and 192 on 11 November, 876 and 198 on 12 November, 892 and 202 on 13 November, 899 and 173 on 14 November and 819 and 211 on 15 November, with the cells at 420 / 384, 426 / 400, 419 / 387, 432 / 397 and 404 / 374. Our own records at the airport did not follow on 3 November; on 4 November they came closer, settling at 449, not all the way; 6 November, settled at 553, is the first complete day since 24 October inside the pre-gap range, and 7 November settled at 635; on 8 November they thinned again, to 235, while the second aggregate fell to 299; 9 November is final at 337, and on 10 to 14 November, when the second aggregate counted 819, 862, 876, 892 and 899, our records — filled by a catch-up batch on 17 November — are final at 609, 676, 736, 766 and 714, complete days at or above the pre-gap range. We report all of it as measured and do not attribute it.
- Aircraft kept leaving for Mumbai. We took the 151 callsigns that flew into BOM on at least two of the three days 12–14 October from Delhi, Bengaluru, Chennai, Ahmedabad, Kolkata, Goa and Dubai, and followed them, counting one departure per callsign, origin and day. After 07:00 UTC they made 95 / 99 / 99 departures on 12, 13 and 14 October, and 82 / 89 / 88 of those were seen landing at Mumbai. On 15 October after 07:00 they made 88 — 89–93% of those days — and 0 were seen landing at Mumbai; 77 ended with no landing observed anywhere, 11 at other airports (4–6 on the days before, mostly callsigns that fly more than one sector). On 16 October, with all three ingest nights in, they made 75 — 76–79% of the days before 15 October — none seen landing at Mumbai, 60 with no landing observed, 15 at other airports (Delhi 4; Abu Dhabi, Kadapa and Bhavnagar 2 each; five others 1 each). 17 October, all three nights in: 74, 14 at other airports. 18 October, all three nights in: 61 — 62–64% — 7 at other airports. 19 October, all three nights in: 77 — 78–81% — 9 at other airports. 20 October, all three nights in: 79 — 80–83% — 7 at other airports. 21 October, all three nights in: 84 — 85–88% — 11 at other airports. On 22 October, all three nights in, they made 90 departures toward Mumbai and 77 of them were seen landing there, against 82–89 on 12–14 October — the first Mumbai landings since 15 October, back with the receivers; on 23 October, all three nights in, 92, again with 77 seen landing at Mumbai, and on 24 October 83, 73 of them seen landing there (settled). The test stops at 24 October: 25 October is the first day of the northern winter timetable season, and the callsigns turned over with it — the share of each day’s departure callsigns at Delhi that had also flown from Delhi on the same weekday a week earlier fell from 83–88% on 21–24 October to 32% on 25 October (Bengaluru 79–83% to 28%), so a list built on 12–14 October no longer follows the same services. A correction, made openly: the 20 October version of this page gave 60, 57 and 41 for 16–18 October and described them as more complete than they were — they were counts after one or two ingest nights, and the third night added 13–15 departures to each of those days (and 17 to 19 October, from 60 to 77; 20 October went from 64 to 79 and 21 October from 67 to 84 the same way). To test whether a fixed list of callsigns simply drifts off its routes within a week, we ran the same test for Bengaluru-bound and Delhi-bound callsigns from the same origins: on 16, 17, 18 and 19 October they ran at 96 / 96 / 89 / 98% and 100 / 101 / 88 / 90% of their 12–14 October mean, against 77 / 76 / 62 / 79% for the Mumbai-bound set. The shortfall toward Mumbai is real in our records and specific to Mumbai; we report it and do not attribute it — fewer flights dispatched, a few diversions (7–15 landings elsewhere a day on 15–19 October against 4–6 before), and Mumbai-bound records thinning as more of each route sits inside the hole would all read this way from here. The departures toward Mumbai are what the data shows; where those flights came down, our receivers did not see.
- The hole has a shape, and it is geographic. Pune (PNQ), 124 km east, logged 6 observed movements on 15 October against ~17 a day — every one of them before 07:00 UTC, the same cutoff. Landings seen at Juhu, Mumbai’s second field, fell from 8–13 a day to 2. Goa, 430 km south, came in at 70 against ~93 (−25%) but kept counting through the day. Ahmedabad, 440 km north, logged 114 landings against 93–116 on the three days before. In the aircraft-telemetry grid behind our GNSS layer, the Mumbai cell (19°N 72°E) saw 197 distinct aircraft on 15 October against 404–444 on each of the seven days before; the cell just east of it fell from 418 on 8 October to 259 on 14 October and 40 on 15 October; the interior-Maharashtra cell (19°N 77°E) and the Delhi cell stayed on their norms (224 and 291). An airport stopping does not erase Pune, Juhu and a 1°×1° cell of overflights; a cluster of receivers going dark does. The cell came back the same way: 0–3 aircraft a day on 16–21 October, then 319 on 22 October, 393 on 23 October and 432 on 24 October (404–444 the week before the gap), with the cell east of it at 192, 340 and 395; on 25 October, the day our airport records thinned again, the two cells carried 373 and 388, and on 26 October–1 November 347 / 216, 350 / 338, 387 / 368, 388 / 380, 377 / 373, 392 / 382 and 373 / 283 — thinner than before the gap, nowhere near the 0–3 of 16–21 October — then 352 / 215 on 2 November and 446 / 414, 435 / 394 and 440 / 416 on 3, 4 and 5 November, back at the pre-gap level; the feed behind the grid has no row for 6 November, on 7 November the two cells carried 372 and 170, on 8 November 283 and 31, on 9 November 343 and 237, on 10 November 425 and 396, on 11 November 420 and 384, on 12 November 426 and 400, on 13 November 419 and 387, on 14 November 432 and 397 and on 15 November 404 and 374, back at the pre-gap level.
- The second count fell too — and it is not independent at the receiver level. A separate crowdsourced ADS-B aggregate counted 861–912 movements a day at Mumbai on 1–11 October, then 790 / 730 / 730 on 12–14 October (arrivals sliding first: 357, 331, 316 against 409–453 before) and 183 on 15 October (130 departures / 53 arrivals), with no Mumbai row at all for 16–21 October, 494 on 22 October, 796 on 23 October and 862 on 24 October — back inside its 1–11 October range — then 496 on 25 October, 260 on 26 October, 314 on 27 October, 382 on 28 October, 415 on 29 October, 391 on 30 October, 452 on 31 October, 439 on 1 November, 503 on 2 November, 730 on 3 November, 854 on 4 November and 756 on 5 November, no row for 6 November (missing across its whole feed), 635 on 7 November, 299 on 8 November, 524 on 9 November, 819 on 10 November, 862 on 11 November, 876 on 12 November, 892 on 13 November, 899 on 14 November and 819 on 15 November. The same aggregate lost Pune earlier: 182–228 a day to 11 October, 109 on 12 October, 53 on 13 October, no row from 14 to 22 October, 136 on 23 October, 183 on 24 October, 211 on 25 October, 101 on 26 October, 172 on 27 October, 204 on 28 October, 211 on 29 October, 215 on 30 October, 175 on 31 October, 48 on 1 November, 98 on 2 November, 223 on 3 November, 203 on 4 November, 204 on 5 November, 30 on 7 November, no row on 8 November, 106 on 9 November, 194 on 10 November, 192 on 11 November, 198 on 12 November, 202 on 13 November, 173 on 14 November and 211 on 15 November. Its Bengaluru count held at 701–742 throughout, 741 on 15 October and 705–758 a day on 16–21 October. The two networks draw on an overlapping pool of volunteer receivers in the same city, so both going dark is consistent with lost receivers — it does not rule out an airport stop on its own; the departures-toward-Mumbai test above is what does the work.
- Coverage note for this airport. Mumbai has never been a clean station in our feed. Through August our receivers saw 19–41 departures a day against ~400 arrivals; 7–13 September both sides read ~300; 14 September to 2 October departures ran 90–220 while arrivals held 270–400; from 3 October departures recovered to 200–280. The arrivals side was the stable one for ten weeks — until it stopped with everything else at 07:00 UTC on 15 October. The September–October step in the 30-day chart above is that departures-side coverage changing, not Mumbai’s traffic.
- Corrections in the chart, made openly: Tuesday 14 October is plotted at 596 (225 departures / 371 arrivals), a fresh recount from raw flight records; at first publication the stored daily count read 517 because the three-hourly refresh re-counted the day from its own hour onward and left it clipped — the same mechanism we have documented on other briefs — and the nightly refresh has since settled it at 596. The same clip briefly hit 15 October: the stored count read 15 (7 departures / 8 arrivals) after the 06:25 UTC refresh on 18 October, and the nightly refresh on 19 October settled it back at 168, matching the recount from raw records. 168 is plotted, unchanged since first publication. The departures-toward-Mumbai figures above were also corrected on this update: the first version counted record rows (118 on 15 October against 106–109), and a flight whose landing is not heard can be stored as several fragments, which inflated the 15 October count; one departure per callsign, origin and day gives the 88 against 95–99 shown above. The departures-toward-Mumbai counts for 16–18 October were corrected on the 21 October update, as described above, and 19 October settled from 60 to 77 and 20 October from 64 to 79 the same way. 16 to 21 October have no bars: zero records after the ingest nights is a gap, not a count. 22 October has no bar: a day whose records start at 06:57 UTC is not a whole day, whatever its hours show. 23 October is plotted at 570, a recount from raw flight records with all three ingest nights in; the stored daily count read 508 for it, clipped by the same three-hourly refresh, and has since settled at 570. 24 October is plotted at 514, also a recount with all three ingest nights in; the stored daily count read 379 for it, clipped the same way, and has since settled at 514. 25 October has no bar: it has settled at 132 on a recount (the stored daily count read 16 for it, clipped the same way, and now matches the recount), but our records at the airport thin out after its first four hours, so it is not a whole day. 26 October has no bar either: it has settled at 50 on a recount (the stored daily count read 10 for it, clipped the same way, and now matches the recount), with our records at the airport thin from its first hour. 27 October has no bar for the same reason: it has settled at 25 on a recount (the stored daily count read 5 for it, clipped the same way, and now matches the recount), thin from its first hour like 26 October. 28 October has no bar either: it has settled at 79 on a recount (the stored daily count read 3 for it, clipped the same way, and now matches the recount), thin from its first hour like 26 and 27 October. 29 October has no bar for the same reason: it has settled at 78 on a recount (the stored daily count read 4 for it, clipped the same way, and now matches the recount), thin from its first hour like 26–28 October. 30 October has no bar either: 52 on a recount with two of three ingest nights in — its third was skipped across our whole feed — and the stored daily count matches it. 31 October has no bar for the same reason as 26–29 October: it has settled at 65 on a recount (the stored daily count reads 50 for it, clipped the same way, and is not used). 1 November has no bar: settled at 244, thin until 15:00 UTC. 2 November has none either: it has settled at 376 on a recount (the stored daily count reads 195 for it, clipped the same way, and is not used), thin from 14:00 UTC. 3 November has none: final at 166 on a recount with two of three ingest nights in — its third was skipped across our whole feed — thin through the day (the stored daily count reads 107 for it, clipped the same way, and is not used). 4 November has none: it has settled at 449 on a recount (the stored daily count reads 51 for it, clipped the same way, and is not used), counted in every hour but under the baseline with its departures short in the evening — held out for the reason given above. 5 November has none: it has settled at 198 on a recount (the stored daily count reads 26 for it, clipped the same way, and is not used), thin to 18:00 UTC. 6 November is plotted at 553, a recount from raw flight records with all three ingest nights in; the stored daily count reads 24 for it, clipped the same way, and is not used. 7 November is plotted at 635, a recount from raw flight records with all three ingest nights in; the stored daily count matches it. 8 November is a gap: it has settled at 235 on a recount (the stored daily count read 138 for it, clipped the same way, and now matches the recount), thin from 04:00 UTC. 9 November is a gap: final at 337 on a recount with two of three ingest nights in — its third came in almost empty across our whole feed — thin to 08:00 UTC (the stored daily count read 294 for it, clipped the same way, and now matches the recount). 10 to 14 November: their second ingest nights came in almost empty across our whole feed, and a catch-up batch on 17 November carried 106,000–128,000 records for each of 10–16 November; 10–14 November are final at 609, 676, 736, 766 and 714 on a recount with duplicate records removed (the same aircraft and timestamp delivered twice — 2, 6 and 3 of them on 12, 13 and 14 November); the stored daily count matches on 10 and 11 November, reads 738 and 772 on 12 and 13 November (duplicates included) and 18 on 14 November (clipped the same way, not used).
Observed counts are a floor, not a total — and on 15 October, for Mumbai, the floor fell out from under the measurement itself. We are not reading 168 as a day of traffic and we are not reading zero as a closed airport: the evidence says our receivers stopped hearing Mumbai, they started again on 22 October at the rate they had stopped at, and the first complete days back, 23 and 24 October, came in at 570 and 514 — on the baseline. On 25 October the floor thinned again at the airport itself — 132, settled, 50 on 26 October, 25 on 27 October, 79 on 28 October, 78 on 29 October, 52 on 30 October and 65 on 31 October — while departures climbing out of Mumbai kept being heard; on 1 November the airport’s evening came back at its usual rate, settled, and on 2 November its morning, with the evening thin again (376, settled); 3 November is final and thin through the day, 4 November has settled at 449, counted through the day but under the pre-gap range, on 5 November the evening came back from 18:00 UTC (settled at 198), even as the second ADS-B aggregate and the Mumbai grid cell came back to their pre-gap levels, and 6 November has settled at 553 — a complete day at 95% of the baseline, counted in every hour, the first since 24 October. That is the step back this page set as the test for reading the second thinning as coverage too, and it is now met on two days: 7 November has settled at 635, 109% of the baseline. Then on 8 November our records at the airport thinned a third time from about 04:00 UTC — 235 with all three nights in, not plotted, on a day the second ADS-B aggregate’s Mumbai count fell to 299 — and 9 November is final at 337 on two of three nights, thin to 08:00 UTC, while 10 to 14 November, their second ingest nights almost empty across our whole feed and filled by a catch-up batch on 17 November, are final at 609, 676, 736, 766 and 714 — complete days, plotted, on days the second ADS-B aggregate counted 819–899 at Mumbai, back in its pre-gap range. We report 25 October–5 November and 8–9 November as measured, and the shift of departures from Juhu to Mumbai in our records on 10–14 November, and do not attribute them. Live view: BOM airport brief.
What it means for flights
What fired, and why we are publishing it. Our detection layer flagged BOM when the 15 October observed count came in at −67% against Mumbai’s ~511 seven-day rolling average — at India’s second-busiest airport, the kind of number that becomes a headline within the hour. Automated multi-signal analysis then cross-checked it against every other layer we track: the hour-by-hour shape of the count, the ingest batches that normally fill a day in, the behaviour of flights bound for the airport, neighbouring airports, a second ADS-B count, FIR-level aircraft counts, closure signals, weather reporting and GNSS interference. None of them corroborates a disruption, and several of them — Pune cutting off at the same hour, the Mumbai grid cell halving, a second network going dark in the same city — point at our own instruments. We publish it anyway, for two reasons. A raw −67% at Mumbai is exactly the figure that gets misread, and the honest answer is more useful than silence: we cannot see the airport, and we can show why we think that is a receiver problem. And a brief that opens on a measurement gap is a promise to close it in public when the signal returns — or to say what the data showed if it does not.
Why the hourly shape settles most of the question. A real traffic collapse at a hub has a ramp: cancellations build, arrivals thin, a few operations straggle through. A receiver cluster going offline has an edge: a normal hour, then nothing. Mumbai on 15 October is the second shape. Hours 00–06 UTC delivered 10 / 20 / 25 / 35 / 22 / 31 / 25, within two of their weekly norm in aggregate (168 against 170); the last departure in our records lifted at 06:51, the last arrival touched down at 06:59, and hour 07 — which averaged 29 movements the week before — holds zero, as does every hour after it, as does 16 October. Our records for a given day arrive in two overnight batches, and the second batch, which normally carries the larger share, added 42 departure records for 15 October — all of them before 07:00. A late-arriving batch fills a thin day in across all its hours; it does not respect a wall at 07:00. The one thing that does respect a wall at 07:00 is a receiver that stopped reporting then.
The test that matters: flights kept leaving for Mumbai. Airlines do not launch a normal day of flights toward an airport that has stopped. So we followed the 151 callsigns that flew into BOM on at least two of 12, 13 and 14 October from Delhi, Bengaluru, Chennai, Ahmedabad, Kolkata, Goa and Dubai, counting one departure per callsign, origin and day. After 07:00 UTC on those three days they made 95, 99 and 99 departures, and 82, 89 and 88 of those were seen landing at Mumbai (the rest were sector changes, or flights whose landing our receivers missed). After 07:00 on 15 October the same callsigns made 88 departures — 89–93% of those days — and none was seen landing at Mumbai; 77 have no landing on record anywhere we cover, and 11 landed elsewhere, against 4–6 on an ordinary day, when they are mostly callsigns that fly more than one sector; we do not read the 11 as diversions. A mass diversion would have put those 77 aircraft down at Ahmedabad, Goa, Hyderabad, Bengaluru or Delhi, all of which we hear well: Ahmedabad logged 114 landings on 15 October against 93–116 on the three days before, Bengaluru’s and Delhi’s departure counts sat inside their weekly range. The flights left; their landings were not heard. That is the signature of a hole in our coverage, labelled as such. The days after are now settled, and they are weaker evidence — we say so. With all three ingest nights in, the same callsigns made 75 departures toward Mumbai on 16 October, 74 on 17 October, 61 on 18 October and 77 on 19 October — 77%, 76%, 62% and 79% of their 12–14 October mean — none seen landing there, and 15, 14, 7 and 9 at other airports. 20 October settled at 79 (81%, 7 at other airports) and 21 October at 84 (86%, 11 at other airports). On 22 October, all three nights in, they made 90 departures toward Mumbai and 77 were seen landing there, against 82–89 on 12–14 October — the first Mumbai landings since 15 October, back near their norm on the day the receivers returned; 23 October, all three nights in, reads 92 departures and 77 landings at Mumbai, and 24 October 83 and 73. The test ends there: 25 October opened the northern winter timetable season, and the callsigns turned over with it — 32% of Delhi’s 25 October departure callsigns had flown from Delhi on the same weekday a week earlier, against 83–88% on 21–24 October — so a list built on 12–14 October no longer follows the same services. (The 20 October version of this page gave 60, 57 and 41 for 16–18 October; they were counts after one or two ingest nights, and the third night added 13–15 departures to each — and 17 to 19 October, from 60 to 77, 15 to 20 October, from 64 to 79, and 17 to 21 October, from 67 to 84; the earlier figures were not complete.) Before reading that as fewer flights, we checked whether a fixed list of callsigns simply drifts off its routes within a week: the same test for Bengaluru-bound callsigns from the same origins reads 96%, 96%, 89% and 98% on those four days, and for Delhi-bound callsigns 100%, 101%, 88% and 90%. It does not drift. The Mumbai shortfall is real in our records and specific to Mumbai, and we still do not attribute it: fewer flights dispatched, some diversions (7–15 landings elsewhere a day on 15–19 October against 4–6 before), or Mumbai-bound records thinning as more of each route sits inside the hole would all read this way from here — the data we hold does not separate them, so we do not pick one. (The first version of this page counted record rows — 118 on 15 October against 106–109 — and a flight whose landing is not heard can be stored as several fragments; the per-departure figures here replace it.)
The hole has edges, and they are on the map. Pune (PNQ), 124 km east of Mumbai, logged 6 observed movements on 15 October against ~17 a day — all before 07:00 UTC, the identical cutoff. Juhu (VAJJ), Mumbai’s general-aviation field 6 km from the main airport, went from 8–13 observed landings a day to 2. Goa, 430 km south, came in at 70 against ~93 but kept counting through the day — the edge of the hole, not inside it. Ahmedabad, 440 km north, was untouched. In the aircraft-telemetry grid behind our GNSS layer, the 1°×1° cell that holds Mumbai saw 197 distinct aircraft on 15 October against 404–444 on each of the seven days before, and the cell immediately east had been thinning for days — 418 on 8 October, 259 on 14 October, 40 on 15 October — while the interior-Maharashtra cell (224 aircraft, unchanged) and the Delhi cell (291, unchanged) held. On 16–21 October the Mumbai cell carried 0–3 aircraft a day and the cell east of it 3–22, while the interior cell held at 203–226; the Delhi cell drifted lower too, 262 to 216, so the FIR-level total’s slide to 31,466 on 20 October and 32,262 on 21 October (−10 to −17% against the ten days before 15 October) is not Mumbai’s alone. On 22 October the Mumbai cell carried 319 aircraft and the cell east of it 192, on 23 October 393 and 340, and on 24 October 432 and 395 — back inside the 404–444 the Mumbai cell carried before the gap — and on 25 October, the day our airport records thinned again, 373 and 388, then 347 / 216 on 26 October, 350 / 338 on 27 October, 387 / 368 on 28 October, 388 / 380 on 29 October, 377 / 373 on 30 October, 392 / 382 on 31 October, 373 / 283 on 1 November and 352 / 215 on 2 November, then 446 / 414 on 3 November, 435 / 394 on 4 November and 440 / 416 on 5 November — back at the pre-gap level; that feed has no row for 6 November, on 7 November the two cells carried 372 and 170, and on 8 November 283 and 31. Overflights at cruising altitude do not stop because an airport does; they stop being counted when the receivers under them do. At FIR level the picture is calm: Mumbai FIR (VABF) as a whole registered 35,077 aircraft-days in the telemetry feed on 15 October against 35,958–37,973 on each of the ten days before (−4%, FIR-level), and GNSS interference across the FIR read 0.05% — its floor, as it has all month. Our FIR-level live aircraft count for VABF, a thin snapshot series that averages ~17 aircraft, began flagging at 07:15 UTC on 15 October, fifteen minutes after the last Mumbai record, and has flagged in most snapshots since; by 22 October the seven-day average it compares against has itself decayed from ~18 to ~4 aircraft, so the flag now says little. We read it as the same receivers going quiet, seen from another angle.
Closures, weather, interference — what the other layers say. On 27 October our detection layer raised two low-confidence automated closure flags for Mumbai FIR (VABF, FIR-level; confidence 0.18, cause unknown), one spanning 15–22 October and one 25–28 October (extended to 28 October on 29 October). Each rests on our own FIR-level traffic-anomaly records — the receiver loss this page describes — and on FIR-wide notices — across the flags’ updates, coast-guard firing practice at sea about 160 km north of Mumbai (dropped from the citations on 30 October, cited again in the 1 November update, dropped again by the 10 November update), skydiving and flying-club training areas more than 400 km away, two danger-area activations, one of them in central India, and, in the 31 October update, an airspace reservation for a test flight about 370 km north-north-east of the airport — none of them a notice for the airport; we read them as an echo of the same traffic dip, a FIR-level statement about airspace signals, not a closure of Mumbai. On 8 November it raised a third, for that day alone (confidence 0.18), on the same thin FIR-level snapshot count described above and on FIR-wide notices — first a cadet training-flying area near Pune, about 120 km south-east of the airport, the test-flight reservation and the flying-club training area in central India, in its 12 November update the skydiving areas and that flying-club area, in its 13 November update the Pune cadet area, the test-flight reservation and a skydiving area, in its 14 November update the Pune cadet area, the flying-club training area in central India and the test-flight reservation, in its 15 November update the skydiving areas and that flying-club area, and in its 16 November update a skydiving area, the Pune cadet area and the test-flight reservation, while the second flag now cites the Pune cadet area, the test-flight reservation and a danger-area activation; again none of them a notice for the airport. Our closure-notice set did not refresh between 4 and 27 October, and it holds only notices still valid, so the absence of a notice there says nothing about 15 October, and we are not leaning on it; refreshed again on 31 October, 1 November and 10, 11, 12, 13, 14, 15 and 16 November, it now holds 26 still-valid notices for Mumbai FIR, and none of them closes or restricts the airport. The airport’s weather station filed 48 reports on 15 October and 48 on 16 October, its normal half-hourly cadence, as it has every day since 17 September: visibility 3,000–4,000 m in smoke through 15 October with no significant cloud, winds up to 9 kt and afternoon temperatures to 38 °C; 2,100–3,000 m in haze and smoke on 16 October with winds to 11 kt; 1,500 m in mist at 02:30 UTC on 17 October with runway 27’s visual range reported at 2,000 m, and 1,500–2,500 m through the rest of 17 October (48 reports again, winds to 11 kt); on 18 October, 1,000–2,500 m in haze and smoke with winds to 11 kt; 1,800–3,000 m on 19 October, 1,300–2,500 m on 20 October, 1,800–3,000 m on 21 October, 2,100–4,000 m on 22 October (the first scattered cloud of the week, at 10,000 ft), 2,800–3,000 m on 23 October, 1,200–2,800 m on 24 October (runway 27’s visual range 2,000 m through the morning mist), 2,100–3,000 m on 25 October, 2,500–3,500 m on 26 October, 2,500–4,000 m on 27 and 28 October, 2,500–3,500 m on 29 October, 1,800–4,000 m on 30 October, 2,100–3,000 m on 31 October, 3,000–3,500 m on 1 and 2 November, 3,000–4,000 m on 3 November and 2,500–3,500 m on 4 and 5 November, 2,200–5,000 m on 6 November, 2,500–4,500 m on 7 November, 1,400–5,000 m on 8 November (runway 27’s visual range 2,000 m from 17:30 to 18:30 UTC) 2,500–5,000 m on 9 November, 2,200–4,500 m on 10 November 2,200–4,000 m on 11 and 12 November 2,500–4,000 m on 13 November, 2,100–3,000 m on 14 November and 2,100–3,500 m on 15 November, all in smoke, haze or mist, winds to 13 kt, 48 reports on each full day to 29 October, 47 on 30 and 31 October (the 20:00 UTC report is missing on the first, the 20:30 UTC report on the second) 48 on each of 1–6 November, 47 on 7 November (the 18:00 UTC report is missing) 48 on each of 8–14 November and 47 on 15 November (the 04:00 UTC report is missing) — the same haze-and-smoke pattern this station has shown all month. The first thunderstorm since 30 September came late on 30 October: rain from 20:30 UTC, a light thunderstorm with rain in the 21:00 UTC report and cumulonimbus at 3,000 ft through 22:30 — five days after our records at the airport thinned again. No gust has been reported since 29 September. That reads as poor visibility, and it is — but it is this station’s ordinary October: across the last 30 days it reported below 5 km on 1,408 of 1,428 observations, and through the same weather the airport ran 490–674 observed movements a day on 3–14 October and 514–570 on 23–24 October. Nothing in the weather record changes at 07:00 UTC on 15 October. The GNSS-interference ratio over Mumbai FIR averaged 0.05% across 5–15 October (range 0.01–0.09%) and read 0.03–0.06% on 16–21 October, and the Mumbai-area grid cells carried single-digit low-integrity counts throughout — the measurement floor. No volcanic-ash exposure is in the frame.
What we cannot say, and what would change this reading. For seven days we could not see Mumbai. Observed counts are a floor, not a total, and from 06:59 UTC on 15 October to about 06:30 UTC on 22 October the floor for this airport was zero because our receivers there were silent, not because we measured anything. We make no claim about Mumbai’s operations in that window: the operating picture belongs to the airport operator, the airlines, the Airports Authority of India and the DGCA, who work from their own complete data. This page is not a verdict about any individual flight. What would turn this from a coverage gap into an event: an official closure or disruption notice for BOM covering 15–21 October; the Mumbai-bound callsigns we track stopping their departures (they have not: 61–84 a day on 16–21 October with all ingest nights in, against 95–99 before, a shortfall we report above), or being seen landing in numbers at other airports (7–15 a day on 15–19 October, against 4–6 before); or, when our receivers return, counts that come back well under the ~580 baseline on complete days. What would close it as a coverage gap: the feed resuming with a step back to normal hourly rates and no ramp — the same edge on the way in as on the way out. The feed resumed at about 06:30 UTC on 22 October — Juhu’s first departure record at 06:30, Mumbai’s at 06:57, Pune’s first arrival at 09:04 — within half an hour of a full week after it stopped, and the Mumbai grid cell went from 3 aircraft to 319 in a day. With all three ingest nights in, 22 October shows 423 movements at Mumbai, 411 of them between 07:00 UTC and midnight against ~410 for those hours on 8–14 October, and the first full hour back, 07 UTC, at 25 against a norm of ~29: that is the step, with no ramp, and the tracked Mumbai-bound departures were seen landing there again (77 against 82–89). That was the first half of the test. The second half was a complete day: 23 October has settled at 570 with all three ingest nights in — 98% of the ~580 baseline, its first seven hours at 169 against 170 and the rest of the day at 401 against ~410 — and 24 October has settled at 514, a Saturday against 490 on Saturday 10 October. Both halves of the coverage-gap test are met. On 25 October our records at the airport thinned again from about 04:00 UTC — settled at 132, Goa and Pune with it, the rest of India counting normally — and 26 October has settled at 50, 27 October at 25, 28 October at 79, 29 October at 78 and 31 October at 65; 30 October reads 52, its third ingest night skipped across our whole feed. That is a fade rather than a wall, and it is partial: the departures our records place at Juhu, in practice Mumbai airline departures, held near their usual rate (238, 232, 213, 208, 201, 217 and 222, against 216–278), and the Mumbai grid cell kept 347–392 aircraft. On 1 November the airport’s records came back at the evening rate from 15:00 UTC (199 movements to midnight, settled, against 169 on Sunday 11 October), and on 2 November for the morning (287 from 00:00 to 14:00 UTC, against 347–441), thinning again from 14:00 UTC; 3 November is final and thin through the day (166 with two of three ingest nights in, its third skipped feed-wide, against 481–624 at that stage), 4 November has settled at 449, counted in every hour but 77% of the baseline with its departures short in the evening, on 5 November the evening came back from 18:00 UTC after a thin day (settled at 198), even as the second ADS-B aggregate and the Mumbai grid cell came back to their pre-gap levels, and 6 November has settled at 553 with all three ingest nights in — counted in every hour, 95% of the ~580 baseline, its departures (217) and arrivals (336) both inside their 8–14 October ranges: the complete day near the baseline the test asks for, the first since 24 October. 7 November has settled at 635, a second; on 8 November the records thinned a third time (235, not plotted). 4 November does not count toward either reading — we cannot tell from our records whether it is a whole day that ran under the baseline or a day still inside the partial hole; Ahmedabad’s records stopped at 08:00 UTC on 1 November, came back only from 13:00 UTC on 3 November and stopped again at 05:36 UTC on 5 November and came back from 07:16 UTC on 9 November. 7 November has settled at 635, 109% of the baseline; 8 November, settled at 235 and thin from about 04:00 UTC, is a third thinning; 9 November, final at 337 on two of three ingest nights and thin to 08:00 UTC, is not plotted, and 10 to 14 November, whose second ingest nights came in almost empty across our whole feed, were filled by a catch-up batch on 17 November and are final at 609, 676, 736, 766 and 714 — complete days, 105–132% of the ~580 baseline, plotted, their departures above the pre-gap range while those our records place at Juhu fell, which we report and do not attribute. The same tests applied to the second thinning — an official notice, or complete days well under the ~580 baseline once the records returned, would have read it as an event, and a step back to the baseline as coverage; no notice has come in, and 6 and 7 November, and 10 to 14 November, are that step. 25 October–5 November and 8–9 November stay reported as measured, not plotted. What it does not tell us is what happened at Mumbai between 07:00 UTC on 15 October and 06:30 UTC on 22 October; those days stay gaps. 15 October is final at 168: all three overnight batches have run and none carried a Mumbai record after 07:00 UTC. 16 to 21 October have all three batches in, with zero Mumbai records in any of them. Automated multi-signal analysis re-checks every layer every three hours, and the BOM airport brief updates from the same cycle; we will update this page if something official says what happened in the gap.
Passenger questions, answered from the data
We cannot say, and we are not guessing. What our data shows is that Mumbai disappeared from our ADS-B feed at 07:00 UTC on 15 October: 168 observed movements in the first seven hours (a normal rate), then nothing for the rest of the day and every day from 16 to 21 October, until records began reappearing at about 06:30 UTC on 22 October. The surrounding evidence — Mumbai-bound callsigns making 88 departures toward the airport after 07:00 against 95–99 on the days before, Pune dropping out of the same feed at the same hour, the Mumbai grid cell halving while interior cells held, a second ADS-B aggregate going dark in the same city — points to lost receiver coverage rather than an airport stop. No closure notice covers the airport (three low-confidence automated closure flags for Mumbai FIR rest on our own traffic counts), the weather station kept reporting on cadence with no storm, and GNSS interference sat at its floor. For a specific flight, check your airline or the airport’s own channels.
The number is real and the day is not: 168 is a seven-hour count, because our receivers stopped hearing Mumbai at 07:00 UTC. For the seven hours they did hear it, the airport ran at 99% of its norm (168 against 170). The other seventeen hours, which carried ~410 movements a day the week before, hold zero — and that zero is the absence of a measurement, not a measurement of absence. Against our ~580 baseline the day reads −71%; against the detector’s ~511 rolling average, −67%; against the 448 same-weekday baseline, −62%. All three describe the length of the data, not the traffic.
We do not know it; we weigh it. Four things point at the receivers. The cutoff is a wall at 07:00 UTC with no ramp, and a late-arriving batch of records added 42 departures for the day, all before the wall. Pune, 124 km away, cut off at the same hour, Juhu’s landings fell to 2, and the Mumbai grid cell of the aircraft-telemetry feed saw 197 aircraft against 404–444 a day before, while interior-Maharashtra and Delhi cells held — overflights do not stop for an airport, they stop being counted when receivers do. The 151 callsigns that flew into Mumbai on 12–14 October made 88 departures toward it after 07:00 on 15 October, against 95–99 on those days, and none was seen landing at Mumbai; 77 have no landing on record anywhere we cover, and a mass diversion would have shown up at Ahmedabad, Goa, Bengaluru or Delhi, which we hear well. And a second ADS-B aggregate, which draws on overlapping volunteer receivers in the same city, went dark in the same window and had lost Pune two days earlier. What would point the other way: an official notice, or the Mumbai-bound departures stopping. No notice has appeared; the departures have not stopped, but they have come in short — 75, 74, 61, 77, 79 and 84 on 16 to 21 October with all three ingest nights in, 62–88% of the days before, while the same test for Bengaluru- and Delhi-bound callsigns holds at 88–101% — and we flag that rather than explain it away.
We publish measured signals, not safety verdicts — operating decisions belong to airlines, the airport operator and the Indian aviation authorities, who work from their own complete data. What we can say is narrow: nothing in the layers we track (closure notices, weather reporting, GNSS interference, ash exposure) indicates anything unusual at Mumbai — the three low-confidence closure flags raised for Mumbai FIR rest on our own traffic counts — and the one layer that changed on 15 October is our own ability to hear the airport. For any specific flight, check your airline on the day of travel.
The 168 is final: all three overnight batches that fill a day in have run for 15 October, and none carried a Mumbai record after 07:00 UTC. 16 to 21 October have all three batches in, with zero Mumbai records in any of them — all are gaps, not counts. Records began returning at about 06:30 UTC on 22 October: 423 observed movements at Mumbai with all three batches in, 411 of them from 07:00 UTC to midnight against ~410 for those hours the week before — a partial day we do not plot. Mumbai was measurable again from 22 October: the first complete day back, Friday 23 October, settled at 570 with all three batches in, 98% of the ~580 baseline from 8–14 October, and Saturday 24 October at 514 — it came back on the baseline, unlike the feed the Beijing brief recorded, which never did. On Sunday 25 October our records at the airport thinned again from about 04:00 UTC — settled at 132 with all three batches in, not plotted — while departures from Mumbai that our records place at the neighbouring Juhu field kept close to their usual rate; 26, 27, 28, 29 and 31 October have settled at 50, 25, 79, 78 and 65, also not plotted, and 30 October reads 52 with two of three batches in, its third skipped across the whole feed. On Sunday 1 November the airport’s records came back at the evening rate from 15:00 UTC, and on Monday 2 November for the morning, thinning again from 14:00 UTC (both settled); Tuesday 3 November is final and thin through the day with two of three batches in (its third skipped across the whole feed), Wednesday 4 November has settled at 449 with all three batches in, counted through the day but still under the pre-gap range with its departures short in the evening, Thursday 5 November has settled at 198 with all three batches in, its evening back from 18:00 UTC after a thin day; none of those days is plotted. Friday 6 November has settled at 553 with all three batches in — counted through the day, 95% of the 580 baseline, the first complete day near it since 24 October — and it is plotted.
For media — the full kit
Everything on this page — charts, CSV, quotes — is published under CC BY 4.0: free to reuse with attribution to FlySafe.zone. Charts come in dark (social/web) and light (print/light layouts) versions; attribution and license are embedded in every file.
“Observed traffic at Mumbai’s Chhatrapati Shivaji Maharaj International fell to 168 movements on Thursday 15 October — flagged as a −67% anomaly against the airport’s seven-day rolling average — but every one of those movements was recorded before 07:00 UTC, at 99% of the normal rate for those hours, after which the airport disappeared from the receiver feed entirely, and did not return until about 06:30 UTC on 22 October, when it came back at the hourly rate of the week before — the first complete day after it, 23 October, counted 570 movements against a ~580 baseline — while callsigns that regularly fly into Mumbai made 88 departures toward it that day, against 95–99 on the days before, and 61–84 a day on 16–21 October, and Pune dropped out of the same feed at the same hour, according to flight-monitoring service FlySafe.zone, which reads the figure as lost receiver coverage rather than a traffic drop and says it could not measure the airport between 15 and 22 October.”
Boilerplate — about the source (for your article footer)
FlySafe.zone monitors airspace risk and observed airport activity worldwide: 334 flight-information regions scored daily, GPS-interference signals, volcanic-ash exposure and daily observed movements at 493 airports from the crowdsourced ADS-B receiver network. Methodology: flysafe.zone/methodology.
Need a different cut of the data, a comment, or numbers for another airport? Leave an email — we answer fast during active events.