Perth (PER) Traffic ‘Drop’ of −60% on Saturday 10 October 2026 — the Airport’s Weekly Saturday Trough, Again
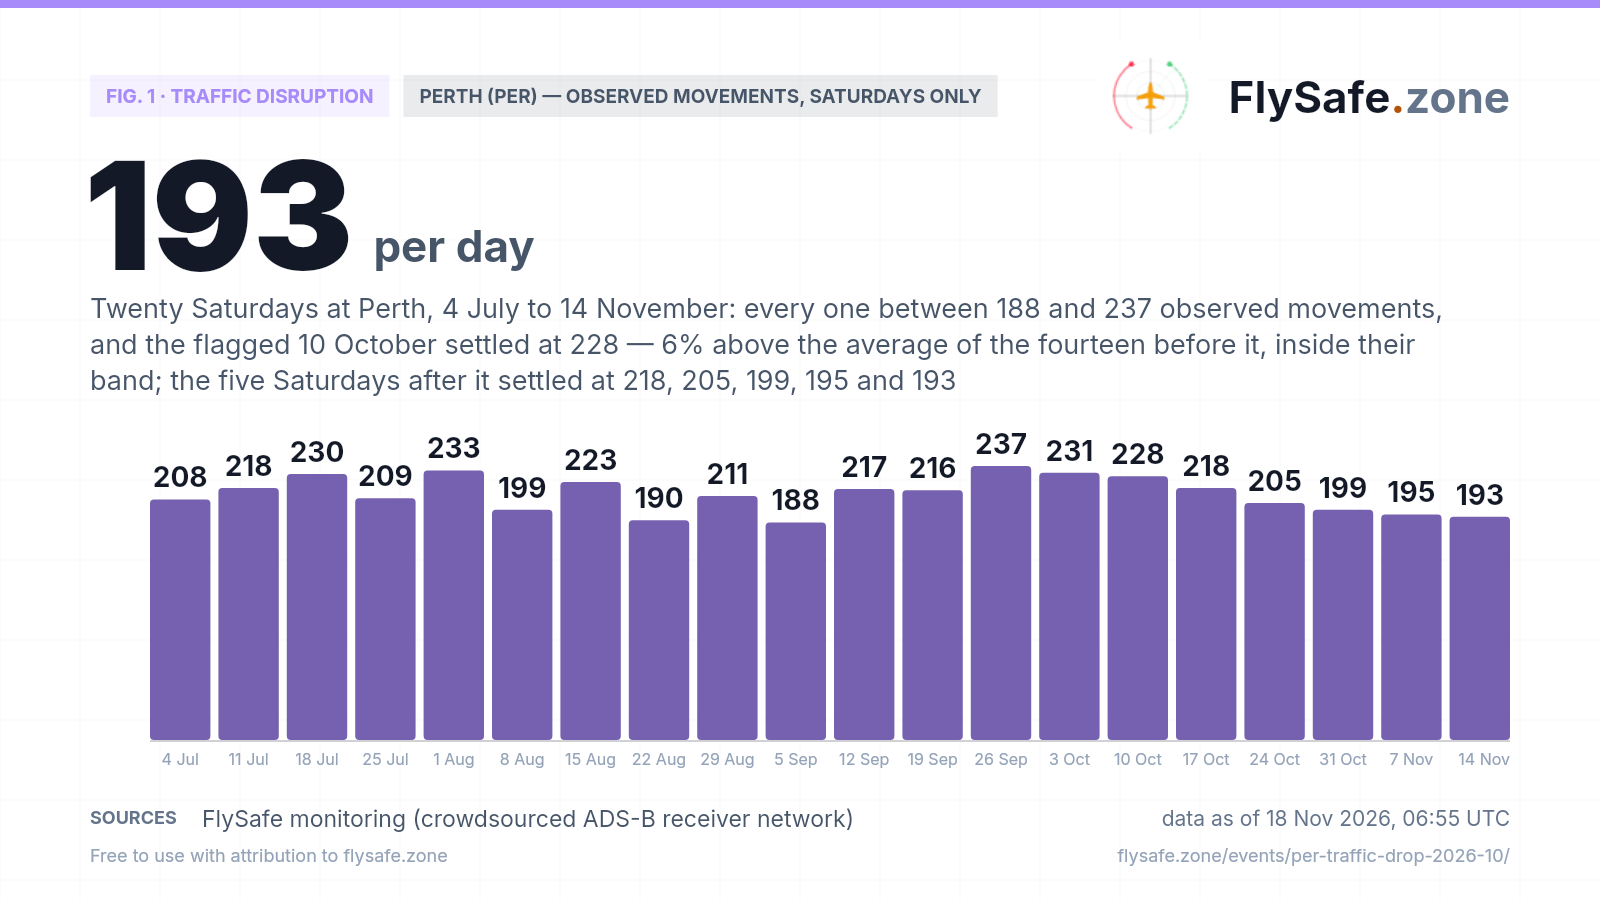
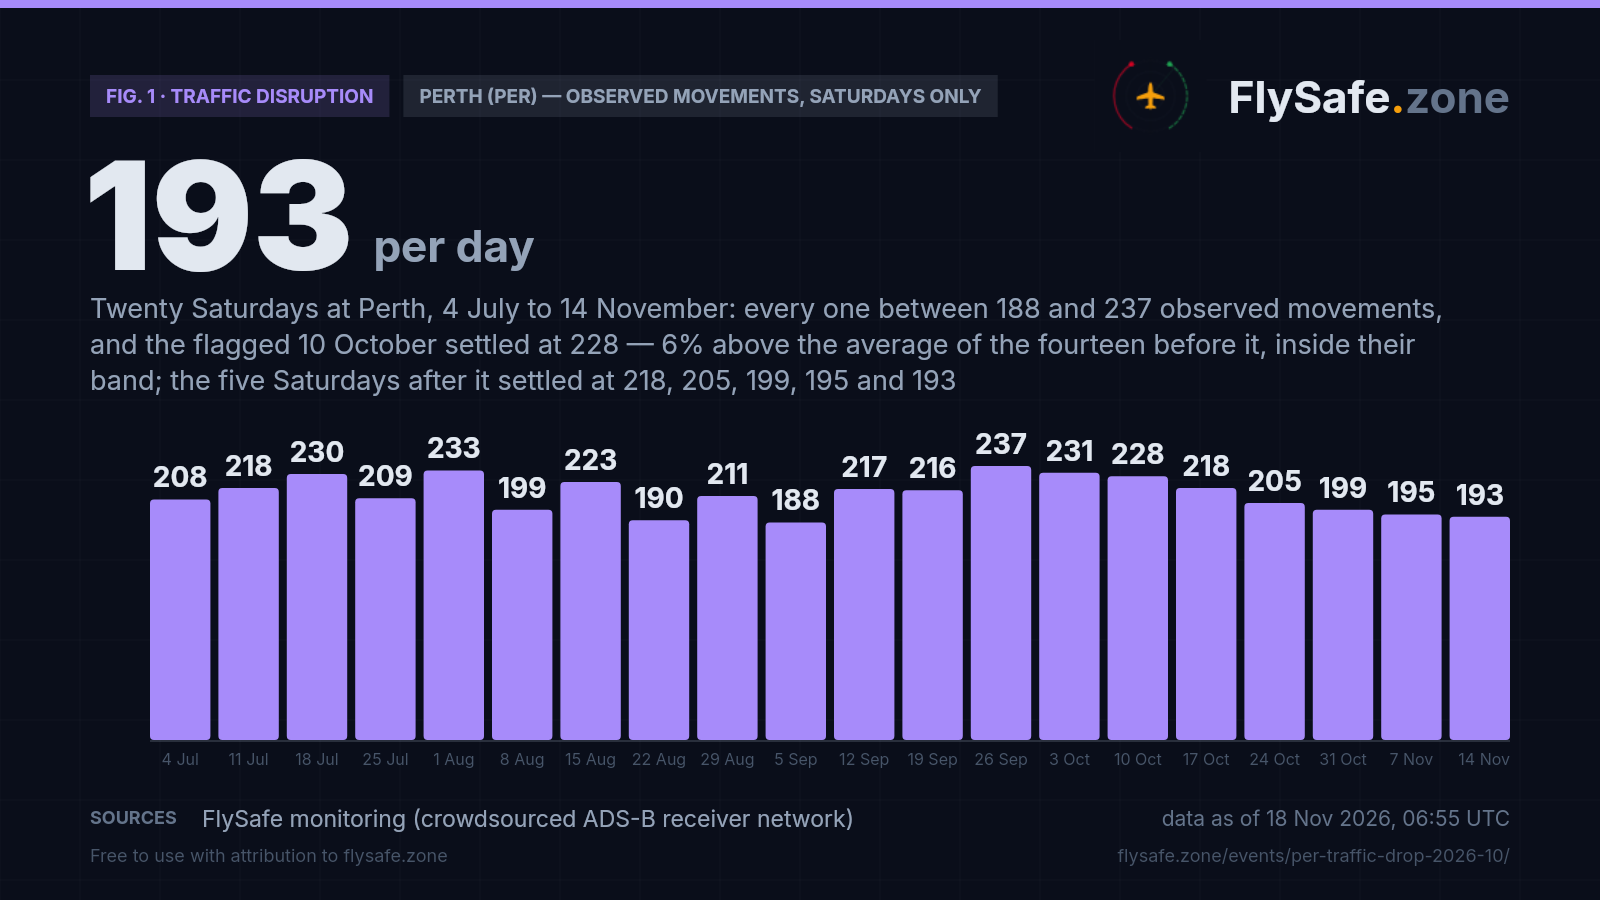
- Nothing in the layers we track points to a disruption at Perth. The −60% ‘drop’ on Saturday 10 October is what a normal Perth Saturday looks like when measured against a weekday-heavy weekly average: a settled 228 observed movements, inside the 188–237 band of the fourteen Saturdays since 4 July and 6% above their 215 average.
- Perth runs one of the deepest weekly rhythms we measure: ~636 observed movements on an average weekday, ~215–225 on a Saturday. Against the same-weekday baseline our own airport detector used, 10 October reads −1%, and a second, independent ADS-B count agreed it was an ordinary Saturday (218).
- No closure, weather-reporting break, GNSS interference or ash exposure registered. The count settled on 14 October at 228, up from the provisional 215 we first published; Sunday 11 October settled at 399, Monday 12 October settled at 653 (+3% against its norm, first read 574), Tuesday 13 October settled at 744 (+5%, first read 666), Wednesday 14 October settled at 672 (−1%, first read 612), Thursday 15 October settled at 724 (+5%), Friday 16 October settled at 455 (−4%), Saturday 17 October settled at 218 (−3%, inside the band), Sunday 18 October settled at 389 (−3%), Monday 19 October settled at 638 (within 1% of its norm, first read 565), Tuesday 20 October settled at 709 (level with its norm, first read 640), Wednesday 21 October settled at 663 (−2%, first read 592), Thursday 22 October settled at 685 (level with its norm, first read 625), Friday 23 October settled at 469 (−1%), Saturday 24 October settled at 205 (−9%, inside the Saturday band), Sunday 25 October settled at 378 (−6%, first read 307), Monday 26 October settled at 634 (level with its norm), Tuesday 27 October settled at 701 (−1%, first read 626, flagged partial for a one-hour network collection gap), Wednesday 28 October reads 672 after its third night (level with its norm, first read 604) and Thursday 29 October a provisional 617 (−10%, third night still to land). For a specific flight, check your airline as always.
Advisory timeline — how active is this episode
The honest baseline for a Saturday at Perth is other Saturdays at Perth. Across the fourteen Saturdays from 4 July to 3 October the network observed between 188 and 237 movements, averaging 215.0. The flagged day, Saturday 10 October, settled at 228 on its nightly refetch of 14 October — up from the provisional 215 we first published, all thirteen added movements on the departures side — which puts it 6% above that average and inside the band every one of those Saturdays occupied. The same flag fired here once before, on Saturday 22 August at −65%; that day sits in this chart at 190, and the brief we opened on it closed after sixteen days with no disruption found. One earlier bar has moved since that page closed: 5 September, published there at 179, has since settled at 188. Same-weekday history, Saturday by Saturday:
Fig. 1 — Observed movements at Perth International (PER) on each Saturday (UTC day), 4 Jul – 24 Oct 2026; 10 Oct settled on its nightly refetch of 14 Oct at 228, up from the provisional 215 first published; 17 Oct settled on its nightly refetch of 21 Oct at 218, up from the provisional 207 first published; 24 Oct settled on its nightly refetch of 28 Oct at 205, up from the provisional 200 first published; 31 Oct, 7 Nov and 14 Nov settled on their nightly refetches of 4, 11 and 18 Nov at 199, 195 and 193 · Data as of 18 Nov 2026, 06:55 UTC · Source: FlySafe monitoring (crowdsourced ADS-B receiver network).
Airports in the exposure zone
| Airport | Size | Observed signal | FIR |
|---|---|---|---|
| Perth International (PER) | large | — · Sat 10 Oct, settled: 228 observed (123 dep / 105 arr) vs ~225 four-Saturday baseline (+1%) · 14-Saturday average since 4 Jul: 215, band 188–237 · −1% vs the 231 detector baseline · independent ADS-B cross-check: 218 · Sun 11 Oct 399 settled · Mon 12 Oct 653 settled (first read 574) · Tue 13 Oct 744 settled (first read 666) · Wed 14 Oct 672 settled (first read 612) · Thu 15 Oct 724 settled (first read 669) · Fri 16 Oct 455 settled (first read 435) · Sat 17 Oct 218 settled (first read 207) · Sun 18 Oct 389 settled · Mon 19 Oct 638 settled (first read 565) · Tue 20 Oct 709 settled (first read 640) · Wed 21 Oct 663 settled (first read 592) · Thu 22 Oct 685 settled (first read 625) · Fri 23 Oct 469 settled · Sat 24 Oct 205 settled (first read 200) · Sun 25 Oct 378 settled (first read 307) · Mon 26 Oct 634 settled · Tue 27 Oct 701 settled (first read 626, partial) · Wed 28 Oct 672 after third night (provisional, first read 604) · Thu 29 Oct 617 provisional | YMMM |
Distance alone does not determine impact — wind direction and the flight levels the ash reaches decide which airports and routes are affected on a given day. FIR = Flight Information Region.
What our monitoring shows: four weekly saw-teeth, 10 October is the fourth trough, the full working week after it settled on its norms, and a fifth trough settled on rhythm at 218
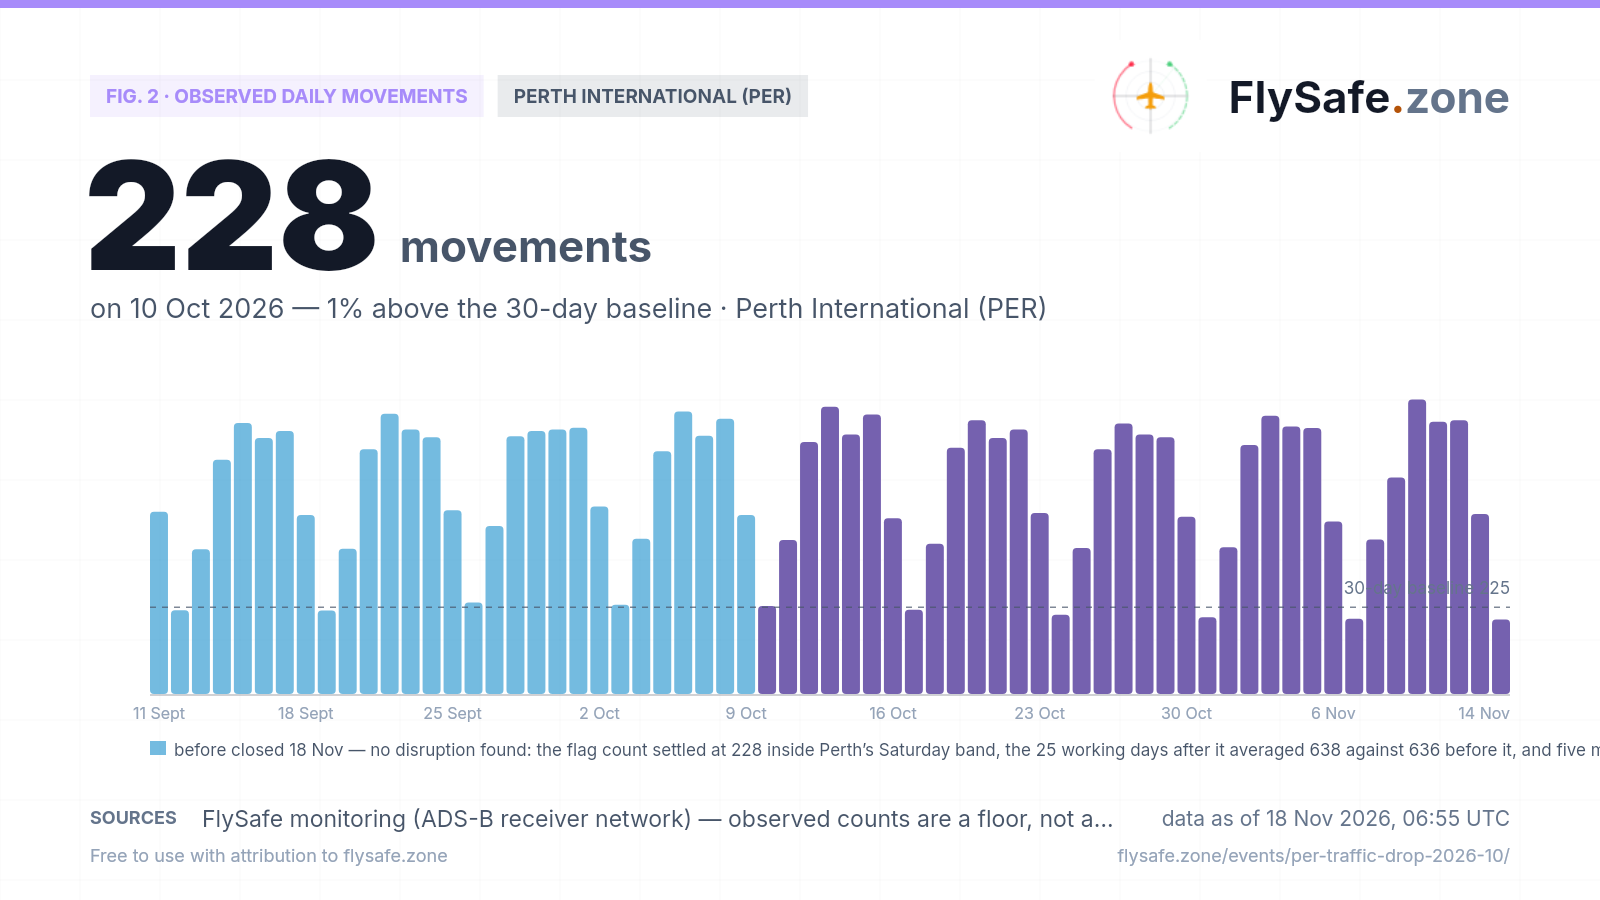
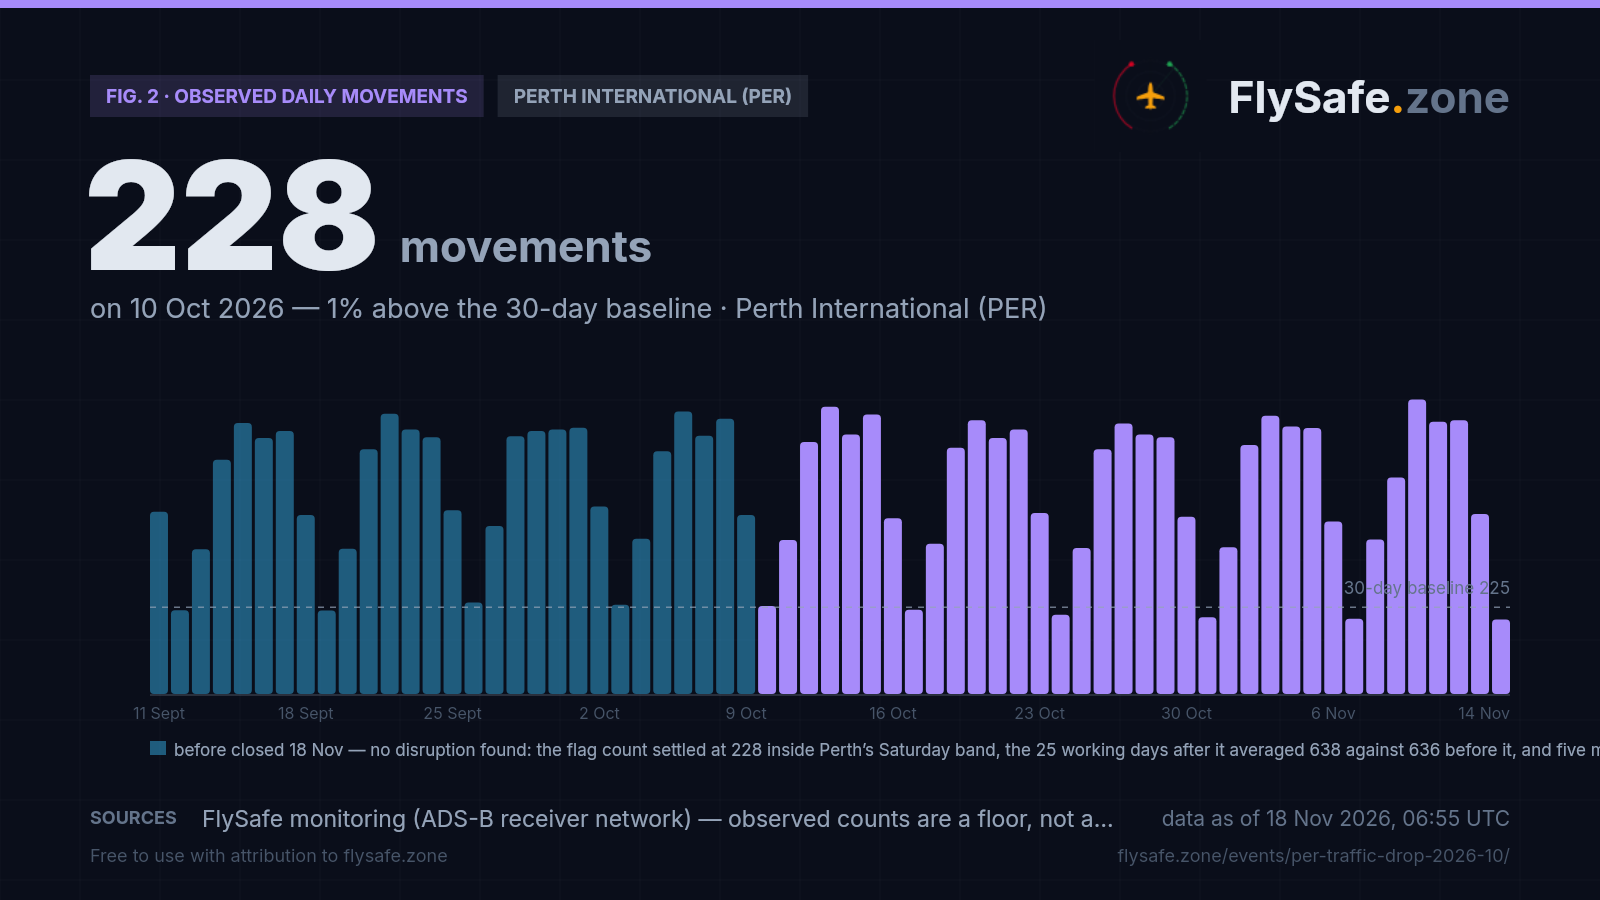
FlySafe tracks observed departures and arrivals at 493 airports from crowdsourced ADS-B receiver data. Observed counts are a floor, not a total — receiver coverage varies — but an airport measured against its own baseline is a reliable shape. Perth International's last 30 days:
Fig. 2 — Observed daily movements at PER, 11 Sept – 14 Nov (latest complete UTC day). Data as of 18 Nov 2026, 06:55 UTC · Source: FlySafe monitoring (ADS-B receiver network).
- Monday–Friday, 14 September – 9 October: ~636 observed movements a day on average across twenty working days — Tuesdays to Thursdays mostly 660–730, Mondays a little lower, Fridays stepping down to ~475.
- Saturdays in the same window: 217, 216, 237, 231 — an average of ~225, the baseline we hold the flagged day to. Sundays recover to ~400. Saturday sits roughly 66% below the working-week average every week.
- Saturday 10 October, settled: 228 observed movements — 1% above the ~225 four-Saturday baseline and 6% above the 215 average of the fourteen Saturdays since 4 July, inside their 188–237 band. Against the 231-movement Saturday baseline our own airport detector used on the day, it reads −1%, well inside the band that detector scores normal. We first published this day at a provisional 215; the nightly refetch of 14 October settled it at 228, and a fresh recount from raw flight records gives the same 228.
- What tripped the flag: the anomaly layer compares each day against a ~533 seven-day rolling average. That average blends five working days and a Sunday with the one quiet Saturday, so any ordinary Saturday at Perth lands near −60% against it. On the settled counts the same comparison reads −58% against a ~548 average. The arithmetic is right; the baseline is the wrong one for this airport.
- The ledger balances: 123 departures against 105 arrivals, the same two-sided shape as the Saturdays before it (3 Oct: 120 / 111; 26 Sep: 125 / 112; 19 Sep: 112 / 104). The thirteen movements the refetch added were all departures (110 → 123); arrivals did not move. A receiver-coverage hole takes departures out of the count first — that one-sided fingerprint is absent here.
- Same answer in Perth’s own calendar. Our daily counts run on UTC days, which start at 08:00 local time in Perth. Re-cut to Perth local days, Saturday 10 October logged 134 departures, against 131 on each of the two Saturdays before it.
- A second, independent count agrees. A separate crowdsourced ADS-B aggregate, which we use as a cross-check and not as our headline figure, counted 218 movements at Perth on 10 October against 226, 221, 245 and 225 on the four previous Saturdays — 5% below their average, where our settled count now sits 1% above its own. Both readings are inside the ordinary Saturday band; the two feeds differed by up to nine movements, in either direction, on each of those four Saturdays, and by ten on this one.
- Collection was healthy that day. Network-wide observed volume on 10 October ran at about 92% of its 14-day median (90% when we read it on 14 October; the median moves with its rolling window), well above the 60% floor below which we stop treating a day as measured. Stored count and a fresh recount from raw flight records agree exactly (228).
- Corrections in the chart, made openly: Friday 9 October, which we first published from a clipped stored count of 371 and plotted from a recount of 463, has settled at 464 (248 departures / 216 arrivals), 2% under the ~475 Friday norm. Saturday 10 October settled from 215 to 228, as above. Monday 12 October, first read at 574, settled at 653 after its third night of flight records. Tuesday 13 October, first read at 666, settled at 744 after its third night. Wednesday 14 October, first read at 612, settled at 672 after its third night. Thursday 15 October, first read at 669, now plots at 724 after its third night (details below). All six moved up as late-arriving flight records landed — the usual direction for a settling day, though the August brief recorded moves both ways.
- The climb-out after the trough: Sunday 11 October — the day the station reported gusts to 34 kt — settled on its nightly refetch of 15 October at 399 observed movements (263 departures / 136 arrivals), exactly the recount we had plotted while the stored day was clipped at 364; that is 1% under the ~400 Sunday norm (376, 435 and 402 on the three Sundays before it). Network-wide collection for that day now reads ~86% of its 14-day median, under the 94–97% of the two previous Sundays, and the Perth count did not move when it settled. The second, independent ADS-B aggregate counted 363 at Perth that day, 1% above its own four previous Sundays. Monday 12 October has moved, and the ‘soft Monday’ reading goes with it. We first read it at 574 (322 departures / 252 arrivals), 9% under the ~635 Monday norm and the lowest Monday in our record since July. The third night of flight records, ingested on 15 October, added 76 departures and 3 arrivals: the recount from raw flight records now reads 653 (398 departures / 255 arrivals), 3% above the ~635 norm (607, 634, 668 and 629 on the four Mondays before it) — an ordinary Monday, and the ‘softest Monday since July’ reading is withdrawn. The chart plots the recount because the three-hourly refresh re-counted the stored day from 06:25 UTC onward and left it clipped at 433 — the same mechanism that clipped 11 October on our last pass. The second aggregate counted 569, 1% above its own three previous Mondays; re-cut to Perth local days, Monday departures were 377, against 365 and 390 on the two Mondays before. It settled on its nightly refetch of 16 October at 653, exactly the recount we had plotted. Tuesday 13 October has moved the same way. We first read it at 666 observed movements (377 departures / 289 arrivals), 6% under the ~710 Tuesday norm, and said it was more likely to rise than fall. Its third night of flight records, ingested on 16 October, added 77 departures and 1 arrival: the recount from raw flight records now reads 744 (454 departures / 290 arrivals), 5% above the ~710 norm (702, 726, 681 and 732 on the four Tuesdays before it) and the busiest Tuesday in the five weeks this chart covers; against the 726 same-weekday baseline our airport detector used it reads +2%. The chart plots the recount because the three-hourly refresh of 12:25 UTC re-counted the stored day from that hour onward and left it clipped at 223 — the same mechanism that clipped 11 and 12 October on earlier passes, and the reason network-wide stored volume for that day read ~65% of median when we wrote on 16 October. The second aggregate counted 608 at Perth, 1% above its own four previous Tuesdays (585, 599, 615, 613); re-cut to Perth local days, Tuesday departures were 448, against 440 and 425 on the two Tuesdays before. It settled on its nightly refetch of 17 October at 744, exactly the recount we had plotted; settled, network-wide volume for that day reads ~101% of median. Wednesday 14 October has risen as we said it was likely to. We first read it at 612 (328 departures / 284 arrivals), 9% under the ~675 Wednesday norm. Its third night of flight records, ingested on 17 October, added 57 departures and 3 arrivals: the recount from raw flight records now reads 672 (385 departures / 287 arrivals), 1% under the ~675 norm (663, 685, 685 and 669 on the four Wednesdays before it) and −2% against the 685 same-weekday baseline our airport detector used. The chart plots the recount because the three-hourly refresh of 15:25 UTC on 17 October re-counted the stored day from that hour onward and left it clipped at 152 — the same mechanism as on 11, 12 and 13 October, and the reason network-wide stored volume for that day read ~49% of median when we wrote on 17 October; it was a clip, not a hole in collection. The second aggregate’s 563 is unchanged, 2% under its own four previous Wednesdays (561, 594, 579, 563); re-cut to Perth local days, Wednesday departures are 420, against 422 and 416 on the two Wednesdays before. It settled on its nightly refetch of 18 October at 672, exactly the recount we had plotted; settled, network-wide volume for that day reads ~103% of median. Thursday 15 October has risen too. We first read it at 669 (386 departures / 283 arrivals), 3% under the ~687 Thursday norm, and said it was more likely to rise than fall. Its third night of flight records, ingested on 18 October, added 54 departures and 1 arrival: the recount from raw flight records now reads 724 (440 departures / 284 arrivals), 5% above the ~687 norm (681, 665, 690 and 713 on the four Thursdays before it) and the busiest Thursday in this chart; against the 690 same-weekday baseline our airport detector used it reads +5%. The chart plots the recount because the three-hourly refresh of 18:25 UTC on 18 October re-counted the stored day from that hour onward and left it clipped at 114 — the same mechanism as on 11–14 October, and the reason network-wide stored volume for that day reads ~31% of median at the moment of writing; it is a clip, not a hole in collection. The second aggregate’s 608 is unchanged, 2% above its own four previous Thursdays (574, 629, 583, 607); re-cut to Perth local days, Thursday departures are now 450, against 424 and 432 on the two Thursdays before. It settled on its nightly refetch of 19 October at 724, exactly the recount we had plotted. Friday 16 October has risen as we said it was likely to. We first read it at 435 observed movements (215 departures / 220 arrivals), 8% under the ~475 Friday norm — the gap entirely on the departures side, which is where a day’s third night of flight records lands at Perth. Its third night of flight records, ingested on 19 October, added 20 departures and no arrivals: the recount from raw flight records now reads 455 (235 departures / 220 arrivals), 4% under the ~475 norm (464, 476, 486 and 464 on the four Fridays before it) and −4% against the 476 same-weekday baseline our airport detector used, which it scores normal. The chart plots the recount because the three-hourly refresh re-counted the stored day and left it clipped at 28 — the same mechanism as on 11–15 October. The second aggregate counted 417 at Perth, 4% under its own four previous Fridays (416, 457, 438, 426) and inside their range. Saturday 17 October has risen as we said it was likely to. We first read it at 207 from a recount of raw flight records (stored count clipped at 202). Its nightly refetch of 21 October settled it at 218 (116 departures / 102 arrivals), 3% under the ~225 four-Saturday baseline and inside the 188–237 band of the fifteen Saturdays before it. The second aggregate counted 210. Sunday 18 October has settled. We first read it at 389 from a recount of raw flight records (stored count clipped at 358); its nightly refetch of 22 October settled it at 389 (262 departures / 127 arrivals), exactly the recount we had plotted, 3% under the ~400 Sunday norm (376, 435, 402 and 399 on the four Sundays before it). Settled, network-wide volume for that day reads ~97% of median. The second aggregate counted 369, level with its own four previous Sundays (344, 404, 358, 363). Monday 19 October has risen as we said it was likely to. We first read it at 565 (318 departures / 247 arrivals), 11% under the ~635 Monday norm. Its third night of flight records, ingested on 22 October, added 70 departures and 3 arrivals: the recount from raw flight records now reads 638 (388 departures / 250 arrivals), within 1% of the ~635 norm (607, 634, 668, 629 and 653 on the five Mondays before it). The chart plots the recount because the three-hourly refresh of 06:25 UTC on 22 October re-counted the stored day from that hour onward and left it clipped at 417 — the same mechanism as on 11–17 October, and the reason network-wide stored volume for that day read ~87% of median when we wrote on 22 October; it was a clip, not a hole in collection. The second aggregate counted 541, 4% under its own four previous Mondays (549, 577, 566, 569); re-cut to Perth local days, Monday departures were 363, against 377 and 365 on the two Mondays before. It settled on its nightly refetch of 23 October at 638, exactly the recount we had plotted; settled, network-wide volume for that day reads ~104% of median. Tuesday 20 October has risen as we said it was likely to. We first read it at 640 (359 departures / 281 arrivals), 10% under the ~710 Tuesday norm. Its third night of flight records, ingested on 23 October, added 68 departures and 1 arrival: the recount from raw flight records now reads 709 (427 departures / 282 arrivals), level with the ~710 norm (702, 726, 681, 732 and 744 on the five Tuesdays before it) and −3% against the 732 same-weekday baseline our airport detector used. The chart plots the recount because the three-hourly refresh of 12:25 UTC on 23 October re-counted the stored day from that hour onward and left it clipped at 203 — the same mechanism as on 11–19 October, and the reason network-wide stored volume for that day read ~68% of median when we wrote on 23 October; it was a clip, not a hole in collection. The second aggregate’s 591 is unchanged, 3% under its own four previous Tuesdays (599, 615, 613, 608); re-cut to Perth local days, Tuesday departures were 434, against 448 and 440 on the two Tuesdays before. It settled on its nightly refetch of 24 October at 709, exactly the recount we had plotted; settled, network-wide volume for that day reads ~105% of median. Wednesday 21 October has risen as we said it was likely to. We first read it at 592 (328 departures / 264 arrivals), 12% under the ~675 Wednesday norm. Its third night of flight records, ingested on 24 October, added 67 departures and 4 arrivals: the recount from raw flight records now reads 663 (395 departures / 268 arrivals), 2% under the ~675 norm (663, 685, 685, 669 and 672 on the five Wednesdays before it). The chart plots the recount because the three-hourly refresh of 18:25 UTC on 24 October re-counted the stored day from that hour onward and left it clipped at 148 — the same mechanism as on 11–20 October, and the reason network-wide stored volume for that day reads ~32% of median at the moment of writing; it is a clip, not a hole in collection. The second aggregate’s 575 is unchanged, level with its own four previous Wednesdays (594, 579, 563, 563). It settled on its nightly refetch of 25 October at 663, exactly the recount we had plotted; settled, network-wide volume for that day reads ~103% of median. Thursday 22 October has risen as we said it was likely to. We first read it at 625 (348 departures / 277 arrivals), 9% under the ~687 Thursday norm. Its third night of flight records, ingested on 25 October, added 58 departures and 2 arrivals, and its nightly refetch of 26 October settled it at 685 (406 departures / 279 arrivals), level with the ~687 norm (681, 665, 690, 713 and 724 on the five Thursdays before it) and −4% against the 713 same-weekday baseline our airport detector used. Settled, network-wide volume for that day reads ~107% of median. The second aggregate’s 590 is unchanged, 3% under its own four previous Thursdays (629, 583, 607, 608). Friday 23 October, after its third night: the recount from raw flight records reads 469 (247 departures / 222 arrivals), 1% under the ~475 Friday norm (464, 476, 486, 464 and 455 on the five Fridays before it). The chart plots the recount because the three-hourly refresh of 03:25 UTC on 26 October re-counted the stored day from that hour onward and left it clipped at 375 — the same mechanism as on 11–21 October; it is a clip, not a hole in collection. The second aggregate counted 425, 2% under its own four previous Fridays (457, 438, 426, 417). It settled on its nightly refetch of 27 October at 469, exactly the recount we had plotted; settled, network-wide volume for that day reads ~107% of median. Saturday 24 October, after its third night: we first read it at 200 (103 departures / 97 arrivals); its third night of flight records added 5 departures and no arrivals, and the recount from raw flight records now reads 205 (108 departures / 97 arrivals), 9% under the ~225 four-Saturday baseline and inside the 188–237 band of the sixteen Saturdays before it; against the 231 same-weekday baseline our airport detector used it reads −11%, which it scores normal. The seven-day rolling comparison that raised the 10 October flag read −62% against a ~523 average on this day too — the same Saturday arithmetic. The chart plots the recount because the three-hourly refresh of 06:25 UTC on 27 October re-counted the stored day from that hour onward and left it clipped at 108 — the same mechanism as on 11–23 October, and the reason network-wide stored volume for that day read ~79% of median when we wrote on 27 October; it was a clip, not a hole in collection. The second aggregate’s 203 is unchanged, 10% under its own four previous Saturdays (245, 225, 218, 210) and the lowest of those five; both feeds put the day on the low side of an ordinary Perth Saturday, not outside it. It settled on its nightly refetch of 28 October at 205, exactly the recount we had plotted; settled, network-wide volume for that day reads ~95% of median. Sunday 25 October has risen as we said was likely, and the ‘lowest Sunday’ reading goes with it. We first read it at 307 (190 departures / 117 arrivals), 23% under the ~400 Sunday norm, and called it the lowest Sunday reading in this chart, with most of the gap on the departures side, where a day’s last night of flight records lands at Perth. Its third night of flight records, ingested on 28 October, added 69 departures and 2 arrivals, and its nightly refetch of 29 October settled it at 378 (259 departures / 119 arrivals), 6% under the ~400 Sunday norm (435, 402, 399 and 389 on the four Sundays before it) and −6% against the 402 same-weekday baseline our airport detector used. It is the softest Sunday since 20 September, but not the lowest in this chart: 13 and 20 September sit lower, at 375 and 376, and the settled day is inside the 375–435 range of the six Sundays before it. Its departures (259) again exceed the second aggregate’s (212), the usual order at Perth on a Sunday, and that aggregate’s 346 is unchanged, 7% under its own four previous Sundays (404, 358, 363, 369). Settled, network-wide volume for that day reads ~91% of median. Monday 26 October, after its third night: the recount from raw flight records reads 634 (381 departures / 253 arrivals), level with the ~635 Monday norm (634, 668, 629, 653 and 638 on the five Mondays before it); its third night of flight records, ingested on 29 October, added 70 departures. The chart plots the recount because the three-hourly refresh of 03:25 UTC on 29 October re-counted the stored day from that hour onward and left it clipped at 526 — the same mechanism as on 11–24 October, and the reason network-wide stored volume for that day read ~89% of median when we wrote on 29 October; it was a clip, not a hole in collection. The second aggregate counted 530, 6% under its own four previous Mondays (577, 566, 569, 541) and the lowest of those five, while ours sits on its norm — the two feeds lean in different directions on this day, and we report both. It settled on its nightly refetch of 30 October at 634, exactly the recount we had plotted; settled, network-wide volume for that day reads ~97% of median. Tuesday 27 October, after its third night: we first read it at 626 (354 departures / 272 arrivals), 12% under the ~710 Tuesday norm. Its third night of flight records, ingested on 30 October, added 73 departures and 2 arrivals: the recount from raw flight records now reads 701 (427 departures / 274 arrivals), 1% under the ~710 norm (726, 681, 732, 744 and 709 on the five Tuesdays before it) and −4% against the 732 same-weekday baseline our airport detector used. The chart plots the recount because the three-hourly refresh of 21:25 UTC on 30 October re-counted the stored day from that hour onward and left it clipped at 124 — the same mechanism as on 11–26 October, and the reason network-wide stored volume for that day read ~15% of median when we wrote on 30 October; that part was a clip, not a hole in collection. One real gap does touch this day, and we flag it as partial: network-wide collection dipped between 12:50 and 13:50 UTC (20:50–21:50 Perth time), and in that hour the network logged 8 movements at Perth, against 23, 19 and 15 in the same hour on the three Tuesdays before it — so 701 reads, if anything, a little low. The second aggregate’s 593 is unchanged, 2% under its own four previous Tuesdays (615, 613, 608, 591). It settled on its nightly refetch of 31 October at 701, exactly the recount we had plotted; settled, network-wide volume for that day reads ~99% of median. The one-hour gap was not back-filled — the network still holds 8 movements at Perth for 12:50–13:50 UTC that day — so the day stays flagged partial on this page. Wednesday 28 October, after its third night: we first read it at 604 (330 departures / 274 arrivals), 11% under the ~675 Wednesday norm. Its third night of flight records, ingested on 31 October, added 65 departures and 3 arrivals: the recount from raw flight records now reads 672 (395 departures / 277 arrivals), level with the ~675 norm (685, 685, 669, 672 and 663 on the five Wednesdays before it) and level with the 672 same-weekday baseline our airport detector used. The chart plots the recount because the three-hourly refresh of 21:25 UTC on 31 October re-counted the stored day from that hour onward and left it clipped at 119 — the same mechanism as on 11–27 October; it is a clip, not a hole in collection. The second aggregate’s 572 is unchanged, level with its own four previous Wednesdays (579, 563, 563, 575). Network-wide, raw flight records for that day run at ~101% of their 14-day median. It settles on its nightly refetch of 1 November. Thursday 29 October, provisional: 617 observed movements (338 departures / 279 arrivals), 10% under the ~687 Thursday norm (665, 690, 713, 724 and 685 on the five Thursdays before it); against the 713 same-weekday baseline our airport detector used it reads −13%, which it scores normal. That is below every settled Thursday in this chart (665–724), but its third night of flight records has not landed yet — the same position Thursday 22 October was in when we first read it at 625, before its third night lifted it to 685. The chart plots a recount from raw flight records because the three-hourly refresh of 00:25 UTC on 1 November re-counted the stored day from that hour onward and left it at 597, twenty departures short. The second aggregate counted 564, 6% under its own four previous Thursdays (583, 607, 608, 590) and the lowest of those five — both feeds read the day on the soft side for now, and we report both. Network-wide, raw flight records for that day run at ~100% of their 14-day median. It settles on its nightly refetch of 2 November.
Observed counts are a floor, not a total — but measured against its own same-weekday history, Perth’s 10 October is an ordinary Saturday, and it stayed one after settling. The full working week after it (Monday 12 to Friday 16 October) has now settled, each day on its norm; Sunday 18 October settled on 22 October at 389, Monday 19 October settled on 23 October at 638 (up from 565 on its third night), Tuesday 20 October settled on 24 October at 709 (up from 640 on its third night), Wednesday 21 October settled on 25 October at 663 (up from 592 on its third night), Thursday 22 October settled on 26 October at 685 (up from 625 on its third night), Friday 23 October settled on 27 October at 469, Saturday 24 October settled on 28 October at 205 (up from 200 on its third night), Sunday 25 October settled on 29 October at 378 (up from 307 on its third night), Monday 26 October settled on 30 October at 634, unchanged from its third-night recount, Tuesday 27 October settled on 31 October at 701 (up from 626 on its third night, flagged partial), Wednesday 28 October reads 672 after its third night (up from 604) and settles on 1 November, and the newest day in this feed is Thursday 29 October, a provisional 617 that settles on 2 November. The Monday moved once, by 79 movements, before settling, the Tuesday once, by 78, the Wednesday once, by 60, the Thursday once, by 55, the Friday once, by 20, the second Saturday once, by 11, the second Sunday not at all, the second Monday once, by 73, the second Tuesday once, by 69, the second Wednesday once, by 71, the second Thursday once, by 60, the second Friday not at all, the third Saturday once, by 5, the third Sunday once, by 71, the third Monday not at all, and the third Tuesday once, by 75. Live view: PER airport brief.
What it means for flights
What fired, and why we are publishing it. Our detection layer flagged PER when the 10 October observed count came in at −60% against Perth’s ~533 seven-day rolling average — a large number at Western Australia’s principal airport. The count has since settled at 228, and nothing in the reading changed. Automated multi-signal analysis then cross-checked it against every other layer we track: closure signals, weather-reporting continuity, volcanic-ash exposure, GNSS interference, the composition of the count, an independent second count, and the airport’s same-weekday history. Nothing corroborated a disruption, and the same-weekday history accounts for the whole signal. We publish it anyway because a raw −60% at a well-known airport is exactly the kind of figure that turns into a phantom headline, and because this is the second time the same comparison has fired here — after the 22 August Saturday flag. Repeating a known false-alarm pattern openly is part of publishing observed counts honestly.
Perth’s week has a deep, stable Saturday trough. Over the last four weeks Perth averaged ~636 observed movements per working day; Fridays step down to ~475, Sundays run near ~400, and Saturday is the low point at ~215–225 — roughly two-thirds below the working week, every week. The trough is stable, not noisy: fourteen consecutive Saturdays from 4 July to 3 October all landed between 188 and 237. A shape this deep is consistent with Perth’s role as the gateway to Western Australia’s resources sector — weekday-heavy fly-in/fly-out charter and business travel, with Kalgoorlie–Boulder (YPKG) and other regional airstrips among its busiest connections in our data — though that mechanism is our interpretation, not a measurement. What is measured is the rhythm, and any detector that compares a Perth Saturday against an all-days average will ‘find’ a collapse that is really a property of the baseline.
Four independent checks, all pointing the same way. Composition: 123 departures against 105 arrivals on the settled count — two-sided, like every recent Saturday, and unlike the departure-first collapse that marks lost receiver coverage. A second count: an independent crowdsourced ADS-B aggregate logged 218 movements, 5% under its own four-Saturday average of ~229. Local calendar: re-cut to Perth local days, Saturday departures were 134, against 131 on each of the two previous Saturdays. Wider airspace: the aircraft-telemetry feed behind our GNSS layer saw 1,196 aircraft over the Perth-area FIR grid on 10 October, its lowest day of the week (2,010–2,970 on the six days before it) — and the previous Saturday, 3 October, dipped the same way, to 1,386 after 2,907 and 2,285 on the two days before it. The quiet runs across the whole regional picture on Saturdays, not at one airport.
Closures, weather, interference, ash — what the other layers say. No airspace-closure event in our detection layer is open for Perth or its FIR (YMMM, FIR-level) on or around the flagged day. The airport’s weather station filed 48 reports on 10 October, on its normal half-hourly cadence: winds up to 15 kt with no gusts reported, showers in the vicinity and light rain showers through the afternoon and evening, visibility 10 km or more in every report, and no thunderstorm. The station kept that cadence through the gusty days that followed — 48 reports on 11 October (gusts to 34 kt), 51 on 12 October (gusts to 35 kt), 49 on 13 October (gusts to 33 kt) — with no thunderstorm and no IFR report among them. On 14 October it filed 51 reports: a clear day to 31 °C that turned to rain overnight, with eight IFR reports from 21:30 UTC (05:30 on the 15th, Perth time) — cloud down to 500–800 ft and visibility down to 2,000 m in rain showers — and three more in the early hours of 15 October UTC (the last at 01:49) before the reports from 05:00 UTC returned to VFR; 15 October closed with 50 reports and no further IFR, 16 October with 48 and none, 17 October with 53 and two IFR special reports a minute apart at 19:03–19:04 UTC (cloud broken at 900 ft in light rain showers), 18 October with 49 and none, with gusts to 28 kt, 19, 20 and 21 October with 48 each and no IFR report among them, and 22 October with 48 and none, with gusts to 25 kt; 23 October closed with 50 reports, one of them IFR — a special report at 02:30 UTC with visibility down to 3,000 m in rain showers — 24 October with 48 and none, with gusts to 26 kt, 25 October with 50 and none, with gusts to 27 kt, 26 October with 48 and none, 27 October with 48 and none, with gusts to 32 kt, 28 October with 48 and none, with gusts to 30 kt, and 29 October with 48, six of them IFR — low cloud down to 100–300 ft, with visibility down to 2,800 m in mist at worst, between 21:10 and 23:30 UTC (05:10–07:30 on the 30th, Perth time); 30 October closed with 48 reports and none, and 31 October with 49, five of them IFR — cloud broken at 100–800 ft, with visibility down to 1,400 m in mist at worst, between 20:06 and 23:00 UTC (04:06–07:00 on 1 November, Perth time), gusts to 22 kt, and VFR again from 23:30 UTC. That is ordinary weather for this station: ten of the last 30 days carried at least one IFR report, and 3 October, a Saturday that measured a normal 231, carried nine reports of it. No thunderstorm was reported on any of these days. Over the last 30 days the station filed 1,474 reports, IFR or worse 3% of the time; the latest (1 Nov, 00:00 UTC) reads wind from the south at 10 kt, visibility 10 km or more, cloud scattered at 1,600 ft, 17 °C. The GNSS-interference ratio over the Perth-area FIR grid averaged 0.0005 across 4–10 October (peak 0.0011, 29 of 29 grid cells measured) — its measurement floor. No volcanic-ash exposure is in the frame.
What we cannot say, and what would change this reading. Observed counts are a floor, not a total: our receiver network does not hear every movement, and we make no claim about Perth’s schedule-level totals. This page is not a verdict about any individual flight; the operating picture belongs to the airport, the airlines and the Australian authorities. The 10 October figure has settled — our nightly refetch settles a day four days after it, and the 14 October refetch moved it from a provisional 215 to 228; Sunday 11 October settled on 15 October at 399, unchanged; Monday 12 October settled on 16 October at 653, having moved once from 574; Tuesday 13 October settled on 17 October at 744, having moved once from 666; Wednesday 14 October settled on 18 October at 672, having moved once from 612. Thursday 15 October settled on 19 October at 724, having moved once from 669; Friday 16 October settled via recount at 455, having moved once from 435, with its stored count clipped at 28 by the same three-hourly refresh mechanism as on 11–15 October. Saturday 17 October settled on 21 October at 218, having moved once from 207; Sunday 18 October settled on 22 October at 389, unchanged from the recount we had plotted; Monday 19 October settled on 23 October at 638, having moved once from 565, exactly the recount we had plotted; Tuesday 20 October settled on 24 October at 709, having moved once from 640, exactly the recount we had plotted; Wednesday 21 October settled on 25 October at 663, having moved once from 592, exactly the recount we had plotted; Thursday 22 October settled on 26 October at 685, having moved once from 625; Friday 23 October settled on 27 October at 469, exactly the recount we had plotted; Saturday 24 October settled on 28 October at 205, having moved once from 200, exactly the recount we had plotted; Sunday 25 October settled on 29 October at 378, having moved once from 307; Monday 26 October settled on 30 October at 634, exactly the recount we had plotted; Tuesday 27 October settled on 31 October at 701, having moved once from 626, exactly the recount we had plotted, and stays flagged partial for a one-hour network-wide collection gap at 12:50–13:50 UTC that was not back-filled; Wednesday 28 October (672, from recount after its third night; stored clipped at 119) stays provisional until 1 November; Thursday 29 October (617) stays provisional until 2 November. Two things would turn this from seasonality into an event: a closure, weather, ash or GNSS-interference signal appearing for Perth or its FIR, or Perth’s working days from Monday 12 October falling away from their own same-weekday norms (Mondays ~635, Tuesdays ~710, Wednesdays ~675, Thursdays ~687, Fridays ~475). All five of those working days sit on their norms: Monday 12 October at 653 (+3%) once its third night of flight records landed — we had read it at 574 and called it soft, and that reading is withdrawn — Tuesday 13 October at 744 (+5%) once its own third night landed, Wednesday 14 October at 672 (−1%) once its third night lifted it from 612, Thursday 15 October at 724 (+5%) once its third night lifted it from 669, and Friday 16 October at 455 (−4%) once its third night lifted it from 435; the second, independent aggregate reads all five as ordinary days; the Sunday that carried gusts to 34 kt settled at 399 against its ~400 norm. Saturday 17 October settled at 218 (−3% against ~225), inside the 188–237 band of the fifteen Saturdays before it. Sunday 18 October settled at 389 (−3% against ~400); Monday 19 October settled at 638 (within 1% of ~635) once its third night lifted it from 565; Tuesday 20 October settled at 709 (level with ~710) once its third night lifted it from 640; Wednesday 21 October settled at 663 (−2% against ~675) once its third night lifted it from 592; Thursday 22 October settled at 685 (level with ~687) once its third night lifted it from 625; Friday 23 October settled at 469 (−1% against ~475), unchanged from its third-night recount; Saturday 24 October settled at 205 (−9% against ~225, inside the 188–237 band); Sunday 25 October settled at 378 (−6% against ~400) once its third night lifted it from 307 — we had said that if it settled well under its norm it would be the first day since the flag to do so; it did not, and it sits inside the 375–435 range of the Sundays before it; Monday 26 October settled at 634 (level with ~635), unchanged from its third-night recount; Tuesday 27 October settled at 701 (−1% against ~710) once its third night lifted it from 626; Wednesday 28 October reads 672 (level with ~675) once its third night lifted it from 604; Thursday 29 October reads a provisional 617 (−10% against ~687), with its third night of flight records still to land. Automated multi-signal analysis re-checks every layer every three hours, and the PER airport brief updates from the same cycle.
What the data showed. We are closing this brief on 18 November with no disruption found. Recovery number: the 25 working days from Monday 12 October to Friday 13 November averaged 638 observed movements a day, against 636 across the 20 working days from 14 September to 9 October — the week the flag fired in and the five that followed it ran at Perth’s pre-flag level. The flagged day itself settled at 228, inside the 188–237 band of the fourteen Saturdays before it, and the five Saturdays after it settled at 218, 205, 199, 195 and 193 — all inside the same band; the twenty-Saturday chart above now runs to 14 November. Since our last update: Thursday 29 October settled at 665 (−3% against ~687), up from the provisional 617 we had flagged for a re-check, so it did not settle below the other Thursdays; Friday 30 October settled at 459 (−3% against ~475); Sundays 1 and 8 November settled at 380 and 400 (against ~400); Monday–Friday 2–6 November settled at 645 / 721 / 693 / 689 / 447 and Tuesday–Friday 10–13 November at 763 / 705 / 709 / 466, every one within 7% of its own weekday norm. One gap day: Monday 9 November is flagged partial on this page — it settled at 561 (306 departures / 255 arrivals, −12% against ~635), but its third night of flight records fell in a run of weak collection nights across the whole network, and the second, independent aggregate reads it at 542, level with the 530 and 533 it read on the two Mondays before; we treat the shortfall as on the collection side, not at the airport. Tuesday 27 October stays flagged partial for its one-hour network-wide collection gap. Days after 14 November are not plotted: Sunday 15 November reads 365 on a recount (244 / 121; the stored figure is clipped by the three-hourly refresh) and the second aggregate reads it at 352, against 341 and 362 on the two Sundays before — it settles on 19 November; 16 and 17 November are still provisional. The other layers stayed quiet across the window: no closure event for Perth or its FIR (the last one recorded predates the flag, on 4 September); the Perth weather station reported on its normal cadence through 1–17 November with a single IFR observation (2 November); no ash signal. One limit: the airport brief currently carries no GNSS-interference ratio for Perth, so we add no fresh interference reading at close. Observed counts are from the crowdsourced ADS-B receiver network (a floor, not a total), cross-checked against a second, independent ADS-B aggregate; weather from published METARs. This page makes no judgement about any flight; the operating picture belongs to the airport, the airlines and the Australian authorities. If a new signal fires at Perth, it gets its own brief.
Passenger questions, answered from the data
No signal in the layers we track indicates a disruption: no closure event for Perth or its FIR, the weather station reporting on its normal cadence with no thunderstorm, GNSS interference at its measurement floor, and no ash exposure. The −60% figure comes from comparing a Saturday against a weekday-heavy seven-day average at an airport whose observed traffic drops about two-thirds every Saturday. Measured against other Saturdays, 10 October’s settled 228 movements were normal — inside the 188–237 band of the fourteen Saturdays since 4 July, 6% above their 215 average, and −1% against the same-weekday baseline our own airport detector used. For a specific flight, check your airline or the airport’s own channels.
In our measurements Perth averages ~636 observed movements on a working day and ~215–225 on a Saturday — a trough of roughly two-thirds that repeats every week, with fourteen consecutive Saturdays from 4 July to 3 October all between 188 and 237. The shape is consistent with Perth’s role as the hub for Western Australia’s resources sector, where weekday fly-in/fly-out and business travel dominate — we label that as interpretation; the rhythm itself is measured.
Against the seven-day rolling average (~533), the provisional count of 215 was 60% lower, and the settled 228 is 58% below the ~548 settled average. Against the right baseline, no: the four Saturdays before it averaged ~225 (+1%), the fourteen Saturdays since 4 July averaged 215 (+6%, inside their 188–237 band), and a second, independent ADS-B count gave 218. The count was a two-sided 123 departures and 105 arrivals, not a coverage hole. The same mismatch produced the −65% flag on 22 August, which closed with no disruption found.
We publish measured signals, not safety verdicts — operating decisions belong to airlines, the airport and the Australian authorities, who work from their own complete data. Nothing in the layers we track (closure signals, weather reporting, ash exposure, GNSS interference) indicates anything unusual at Perth; what our detector flagged on 10 October is, on the evidence, the airport’s normal Saturday rhythm. For any specific flight, check your airline on the day of travel.
It already did, and it is now settled. Our newest days are provisional: a day settles on the nightly refetch four days after it, and the 14 October refetch moved 10 October from 215 to 228 — thirteen more departures, arrivals unchanged, with a fresh recount from raw flight records agreeing at 228. The reading did not change: a normal Saturday either way. Sunday 11 October settled on 15 October at 399, unchanged. Monday 12 October did move: we first read it at 574, and its third night of flight records lifted it to 653 — from a soft Monday to an ordinary one; it settled there on 16 October. Tuesday 13 October moved the same way, from a provisional 666 to 744 on its third night, and settled there on 17 October. Wednesday 14 October moved from a provisional 612 to 672 on its third night and settled there on 18 October. Thursday 15 October moved from a provisional 669 to 724 on its third night and settled there on 19 October; Friday 16 October moved from a provisional 435 to 455 on its third night, with its stored count clipped at 28 by the same three-hourly refresh mechanism; the recount from raw flight records gives 455 and we treat that as settled. Saturday 17 October moved from a provisional 207 to 218 on its nightly refetch of 21 October (116 departures / 102 arrivals) and has settled there; Sunday 18 October settled on 22 October at 389 (262 departures / 127 arrivals), exactly the recount we had plotted; Monday 19 October moved from a provisional 565 to 638 on its third night of flight records and settled there on 23 October; Tuesday 20 October moved from a provisional 640 to 709 on its third night and settled there on 24 October; Wednesday 21 October moved from a provisional 592 to 663 on its third night and settled there on 25 October; Thursday 22 October moved from a provisional 625 to 685 on its third night and settled there on 26 October; Friday 23 October read 469 after its third night (stored count clipped at 375 by the same refresh mechanism) and settled there on 27 October; Saturday 24 October moved from a provisional 200 to 205 on its third night (stored count clipped at 108 by the same refresh mechanism) and settled there on 28 October; Sunday 25 October moved from a provisional 307 to 378 on its third night and settled there on 29 October; Monday 26 October read 634 after its third night (stored count clipped at 526 by the same refresh mechanism) and settled there on 30 October; Tuesday 27 October moved from a provisional 626 to 701 on its third night (stored count clipped at 124 by the same refresh mechanism) and settled there on 31 October, still flagged partial for a one-hour network-wide collection gap; Wednesday 28 October moved from a provisional 604 to 672 on its third night (stored count clipped at 119 by the same refresh mechanism) and settles on 1 November; Thursday 29 October (a provisional 617) settles on 2 November.
For media — the full kit
Everything on this page — charts, CSV, quotes — is published under CC BY 4.0: free to reuse with attribution to FlySafe.zone. Charts come in dark (social/web) and light (print/light layouts) versions; attribution and license are embedded in every file.
“Observed traffic at Perth International fell to a settled 228 movements on Saturday 10 October — flagged as a −60% anomaly against the airport’s seven-day rolling average on a provisional count of 215 — but against its own Saturdays the day was normal: the fourteen Saturdays since 4 July averaged 215 with a range of 188–237, the four just before it averaged about 225, the count was a two-sided 123 departures and 105 arrivals, and a second, independent ADS-B count gave 218, according to flight-monitoring service FlySafe.zone, which found no corroborating closure, weather, ash or GNSS-interference signal in any layer.”
Boilerplate — about the source (for your article footer)
FlySafe.zone monitors airspace risk and observed airport activity worldwide: 334 flight-information regions scored daily, GPS-interference signals, volcanic-ash exposure and daily observed movements at 493 airports from the crowdsourced ADS-B receiver network. Methodology: flysafe.zone/methodology.
Need a different cut of the data, a comment, or numbers for another airport? Leave an email — we answer fast during active events.